Planning a cycle route or mobility hub? Learn how to test it against your workforce’s real commutes before you invest, with a four-step method and two modelled examples from Aarhus.
A new cycle route or mobility hub is a bet on how people will commute. Scenario modelling lets you check that bet before you place it. Here is how it works, what the numbers can and cannot tell you, and two worked examples from Aarhus.
Most mobility investments are judged after they are built. A cycle lane opens, shared bikes appear outside the station, and a year later someone tries to work out whether anything changed.
Intervention modelling reverses that order. You describe the proposed change, apply it to your workforce's actual commutes and see what moves: who is affected, who might switch mode, and what happens to travel time, cost and emissions.
It will not predict the future. What it does is test whether a proposal connects to the journeys it is supposed to improve. That is usually the question that decides whether an idea deserves more time and money.
Mobility intervention modelling evaluates a proposed change to transport infrastructure or services against a baseline. For employers, it links that change to individual commuting journeys, estimates how transport choices might shift, and compares the outcome on cost, travel time, distance, modal split and emissions.
A proposal is ready to model when it has three things:
That is the step that turns "improve cycling" into "upgrade cycling infrastructure in this area", and "improve station access" into "add shared bikes at these stops".
Without a baseline, a lower emissions figure has nothing to be lower than. Compare like with like: the same workforce, the same reporting period, and the same emissions factors and calculation method. Otherwise a change in headcount or office attendance gets credited to the intervention.
Then agree two things before anyone looks at results: which decision the model is meant to inform, and which outcomes matter for it. Travel time, employee costs, mode choice and emissions do not always move together. A proposal meant to improve station access should be judged on complete public transport journeys; an emissions reduction alone does not make an investment case.
One more boundary: the model describes commuting outcomes. The cost of building and running the intervention needs its own assessment.
In triply's Mobility Audit, a scenario runs through four steps. The framework, developed as triply's contribution to the CITWIN research project, combines digital twin base data, employer and employee data, and the scenario you define.
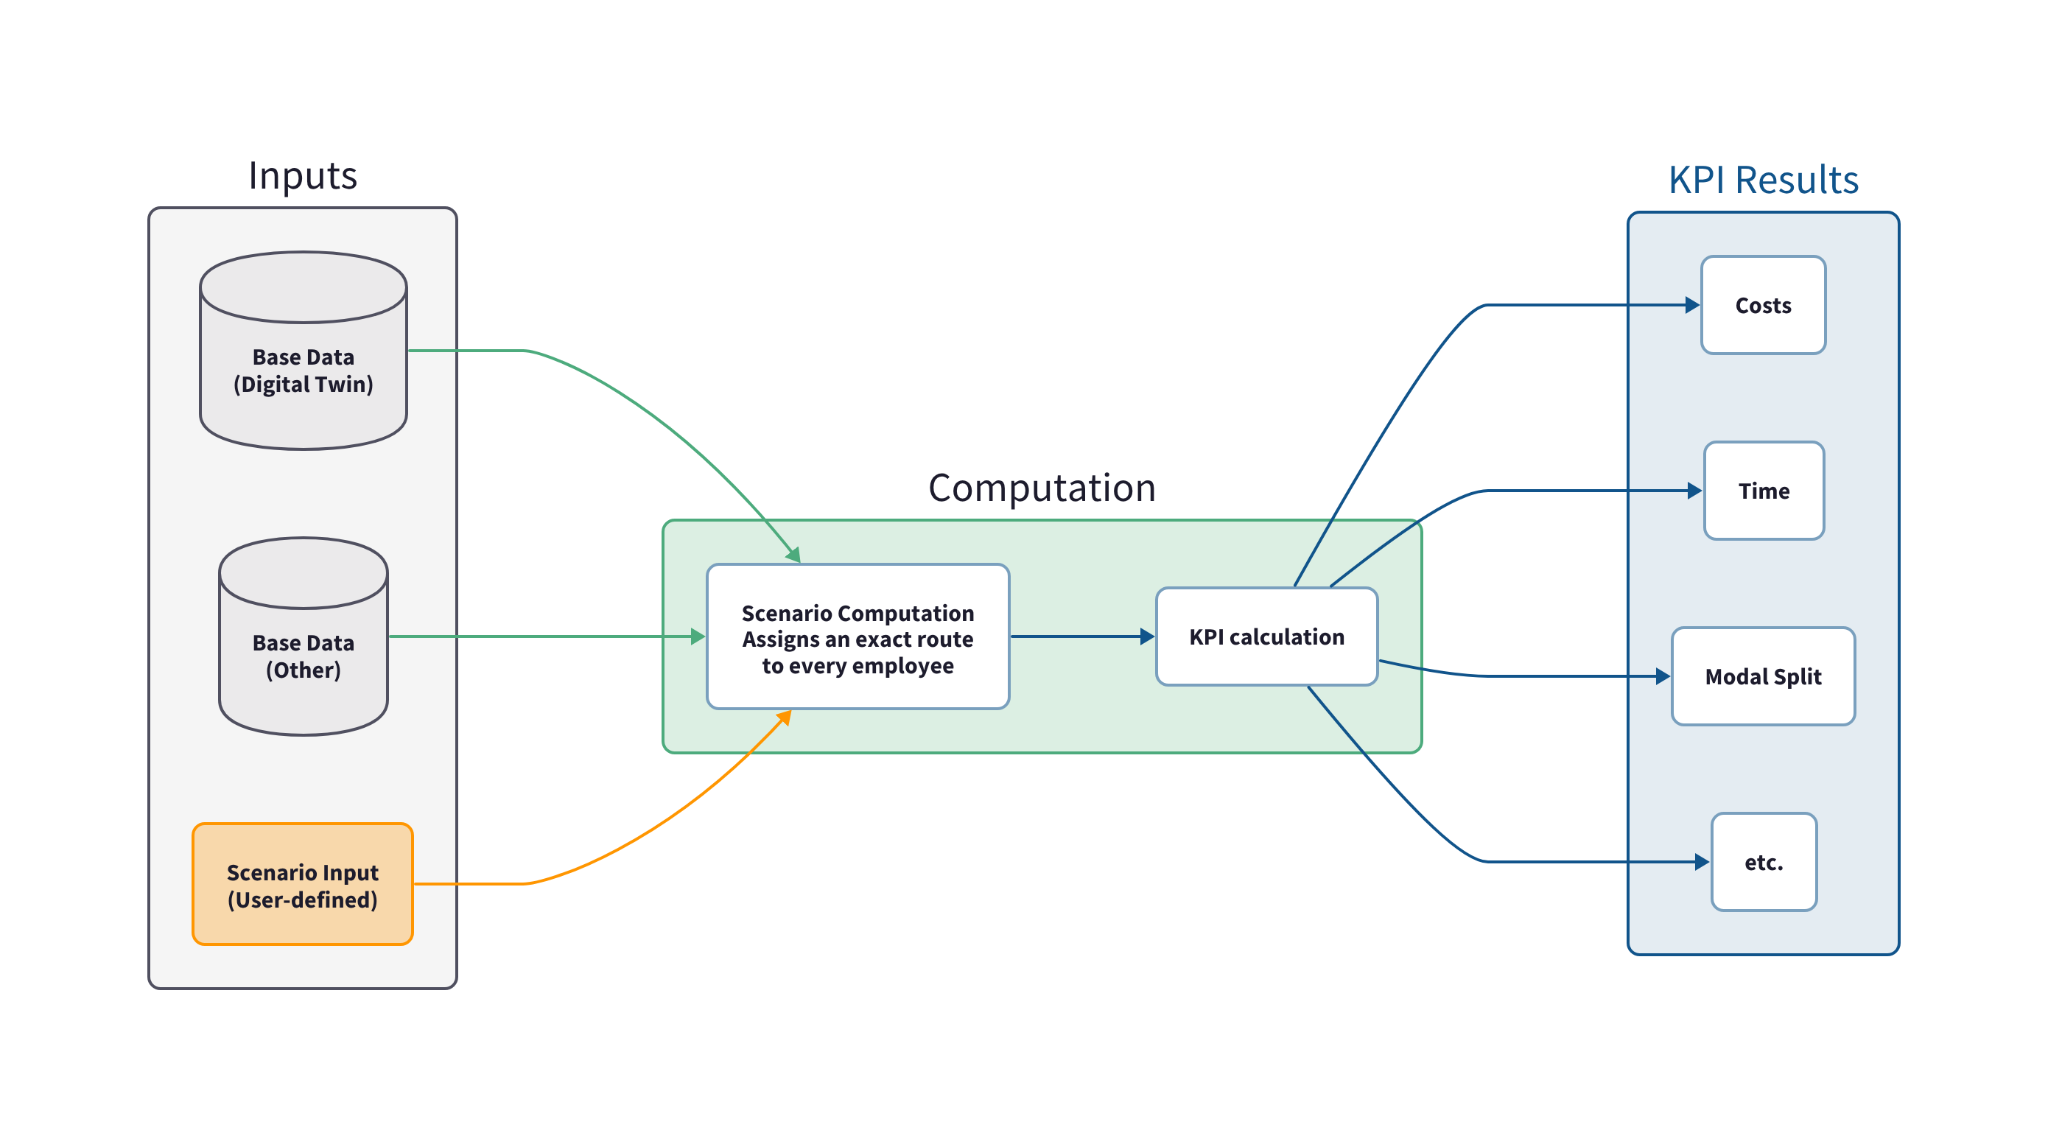
Every scenario follows the same loop: inputs, a route for every employee, then KPIs against the baseline.
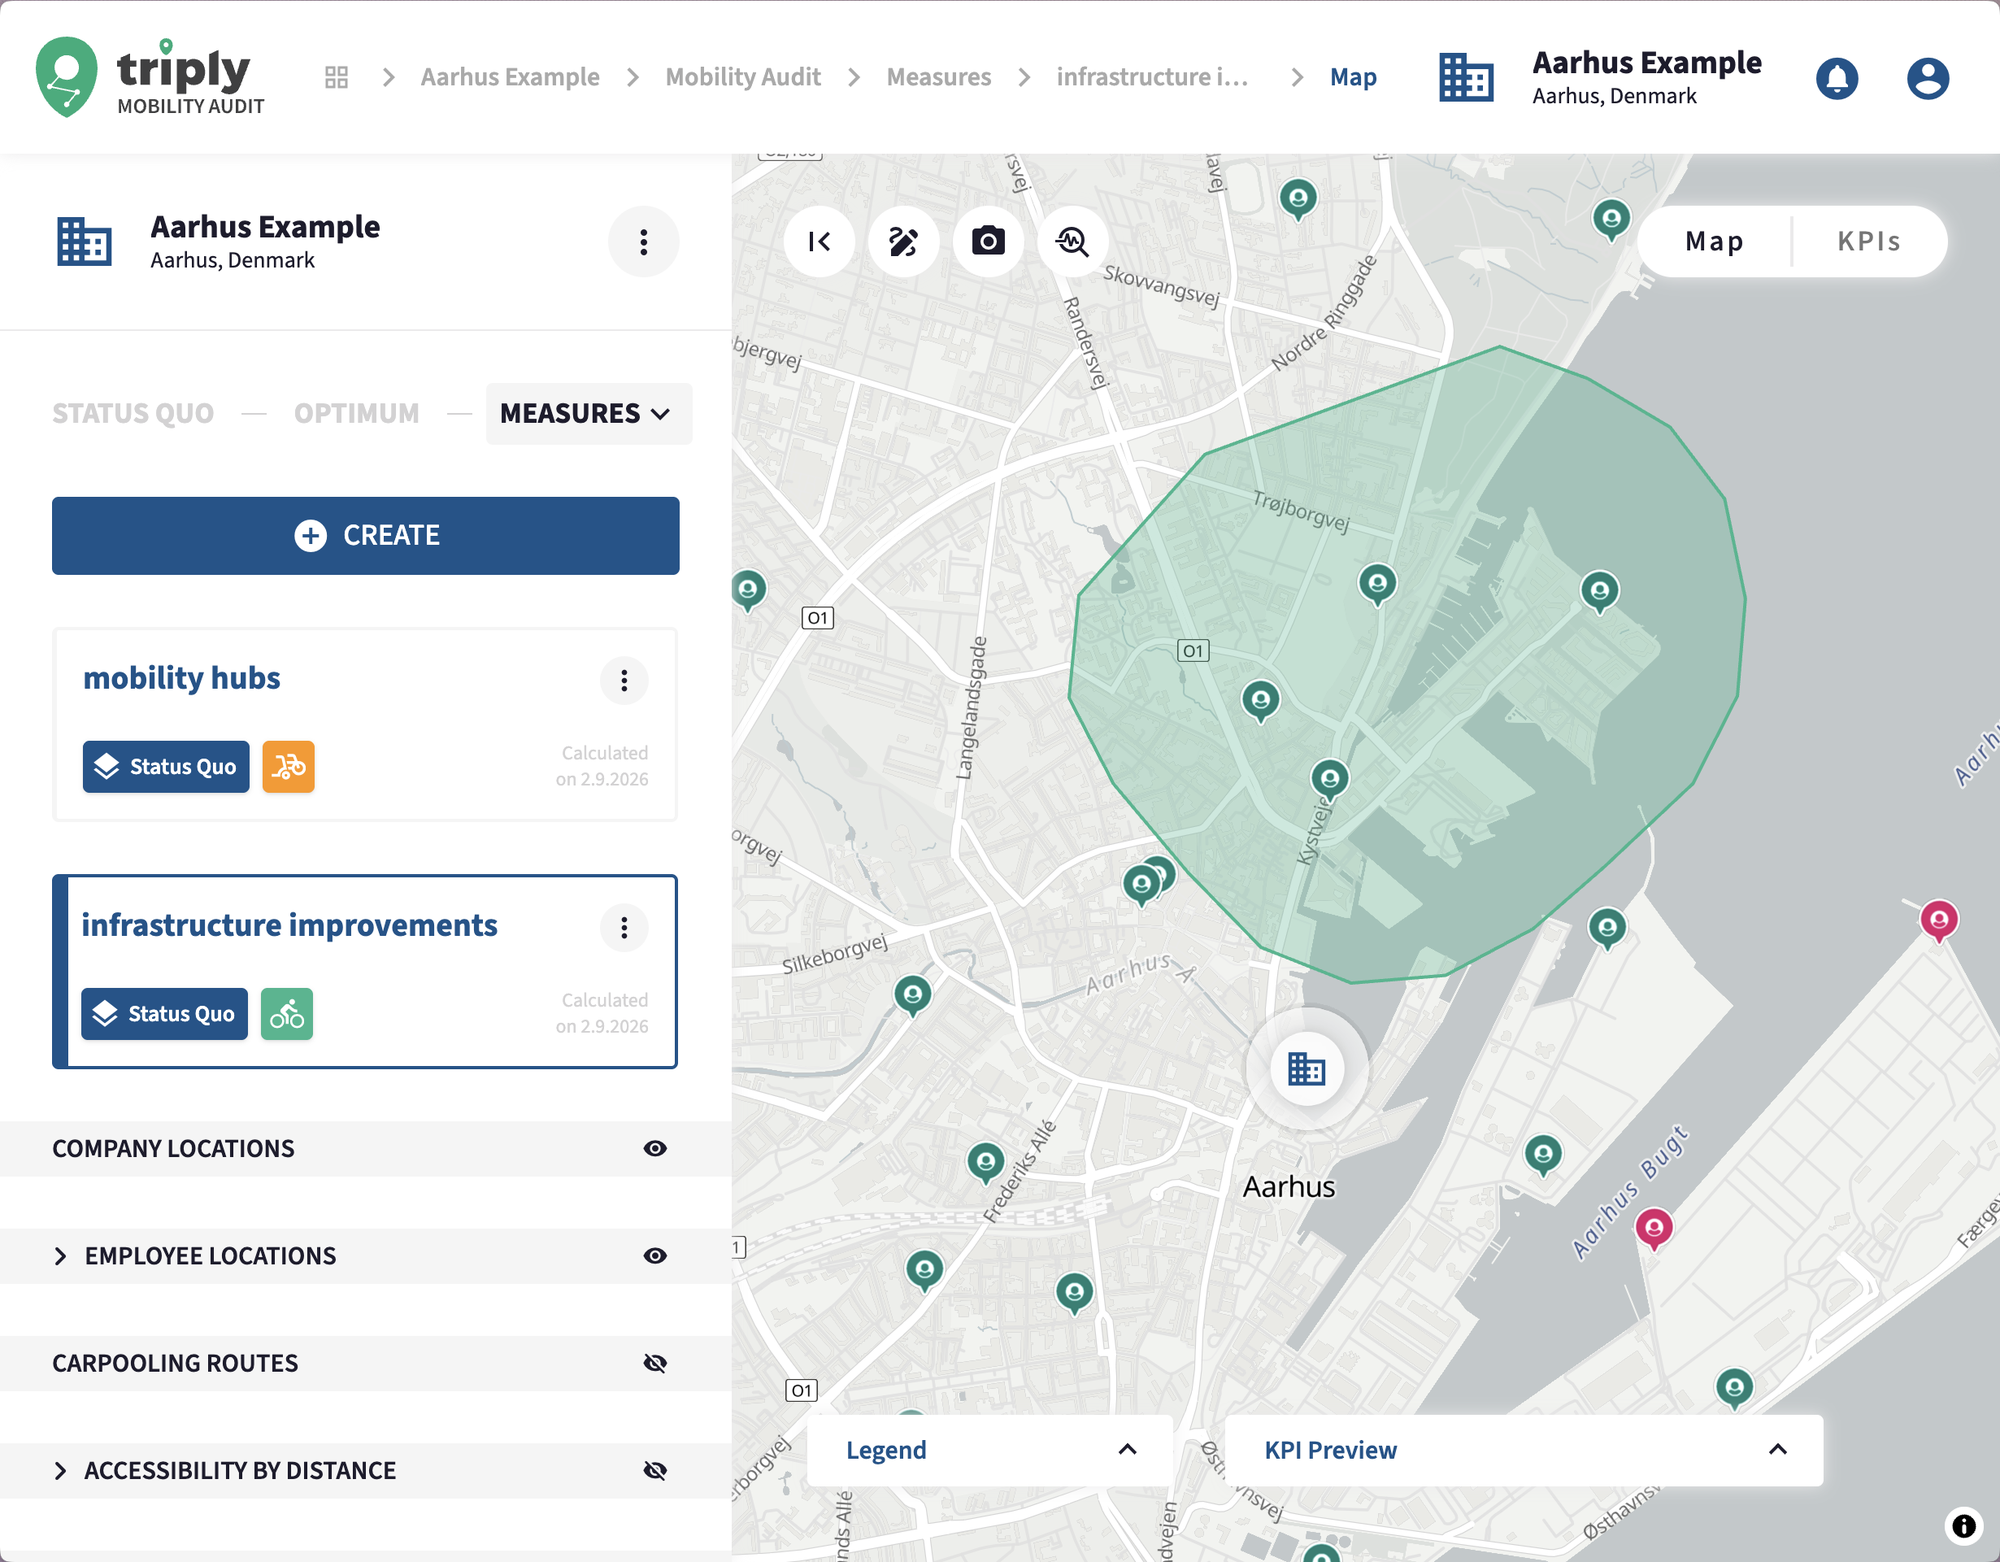
Specify where the change applies and what changes. The Bike Infrastructure scenario uses a selected region and a level of infrastructure improvement. The Mobility Hub scenario uses selected stops and a shared last-mile mode.
Keep the link to the real-world proposal explicit. The improvement setting runs from 0 to 100% and is a model parameter, not a speed. A 100% setting does not mean bike trips become twice as fast. Planners should be able to say what physical change a setting stands for.
The routing engine updates the relevant infrastructure values and recalculates the routes that pass through the change. Because routes are assigned to individual employees, the model evaluates who actually travels through the intervention, not just who lives near it.
The two scenarios work on different parts of the commute. Better cycling infrastructure reduces the effective duration of a bike trip. A mobility hub shortens the leg to or from public transport.
A better option does not mean everyone takes it. The Mobility Audit estimates who would choose the new option under the scenario's assumptions, and reports those employees separately from everyone the intervention affects.
That separation matters. It stops access to an improvement from being reported as uptake.
Results are reported across five KPIs: cost, travel time, distance, modal split and emissions. Modal split can be shown by main transport mode or by person-kilometres, and the two answer different questions: how many people use a mode, and how much of the total distance it carries.
Read the KPIs together rather than picking one. Emissions can fall while employee costs stay flat, and the mode most people use is not necessarily the one covering the most kilometres.
Aarhus is one of CITWIN's two urban living labs, alongside Eskilstuna in Sweden. This example models improved cycling infrastructure within a selected area of the city.
Cycling quality is described with Bicycle Level of Service (BLOS) values. Improving the infrastructure changes those values, which reduces the effective duration of bike trips through the area and makes cycling more likely to be chosen. Only employees whose routes pass through the area are affected; the model does not assume everyone inside a boundary becomes a cyclist.
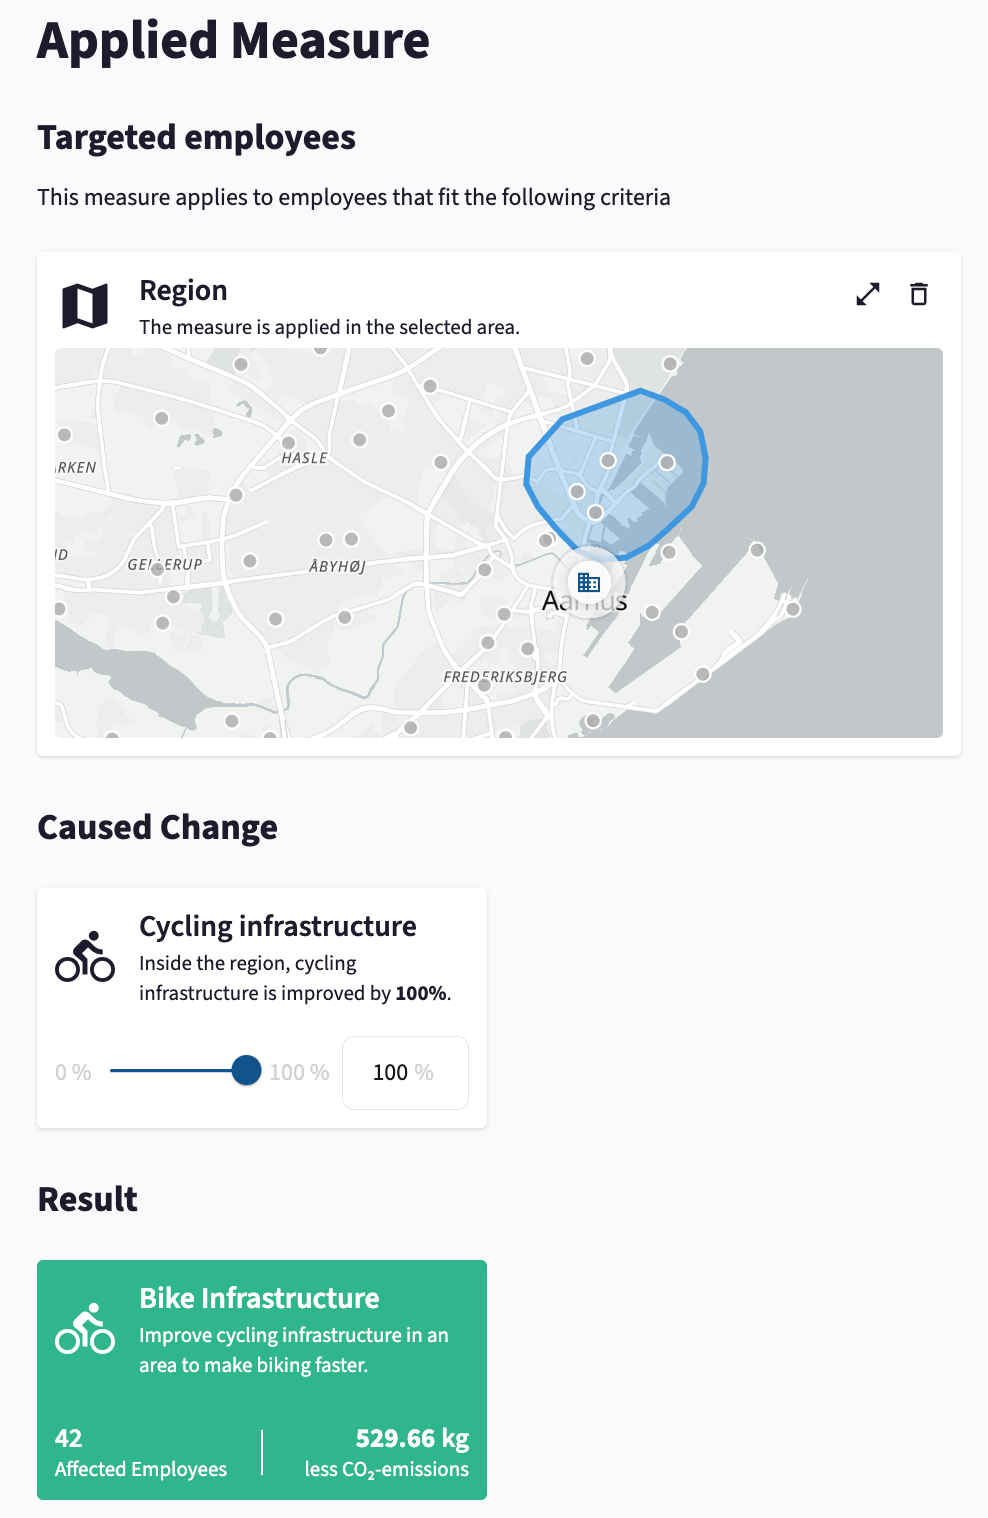
Setting up the scenario: a region near the workplace, with cycling infrastructure improved at the maximum setting.
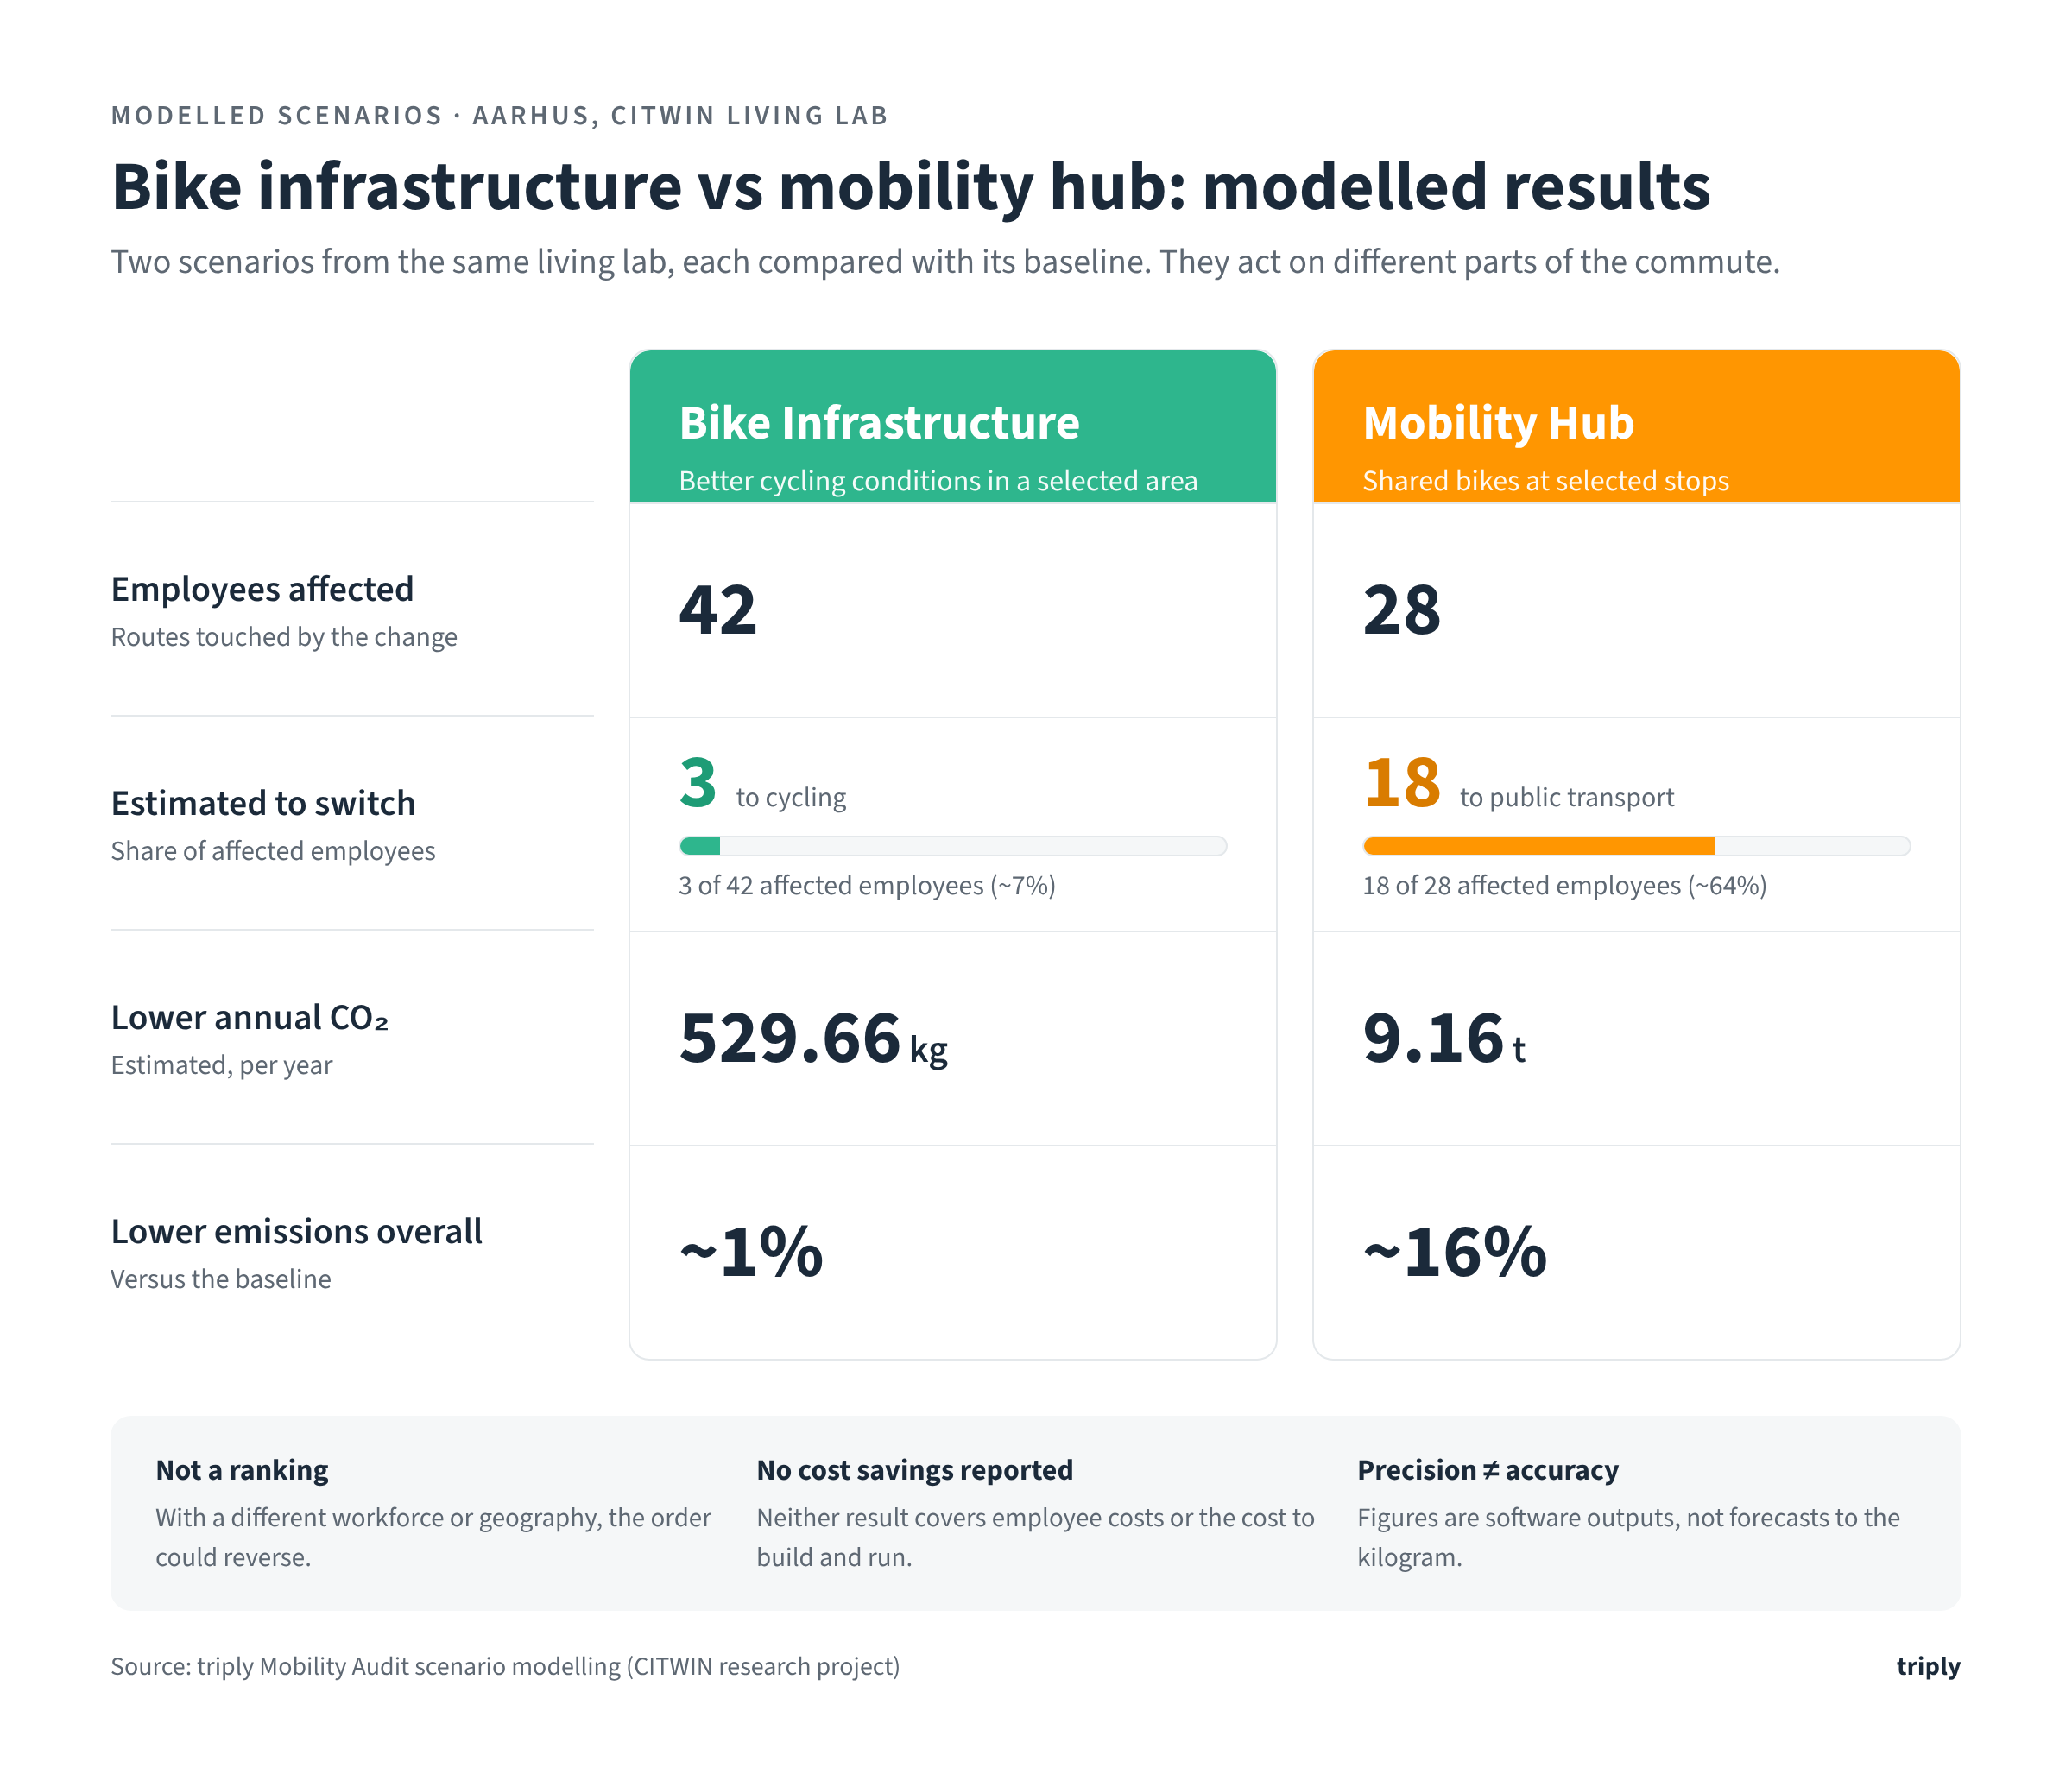
Modelled result:
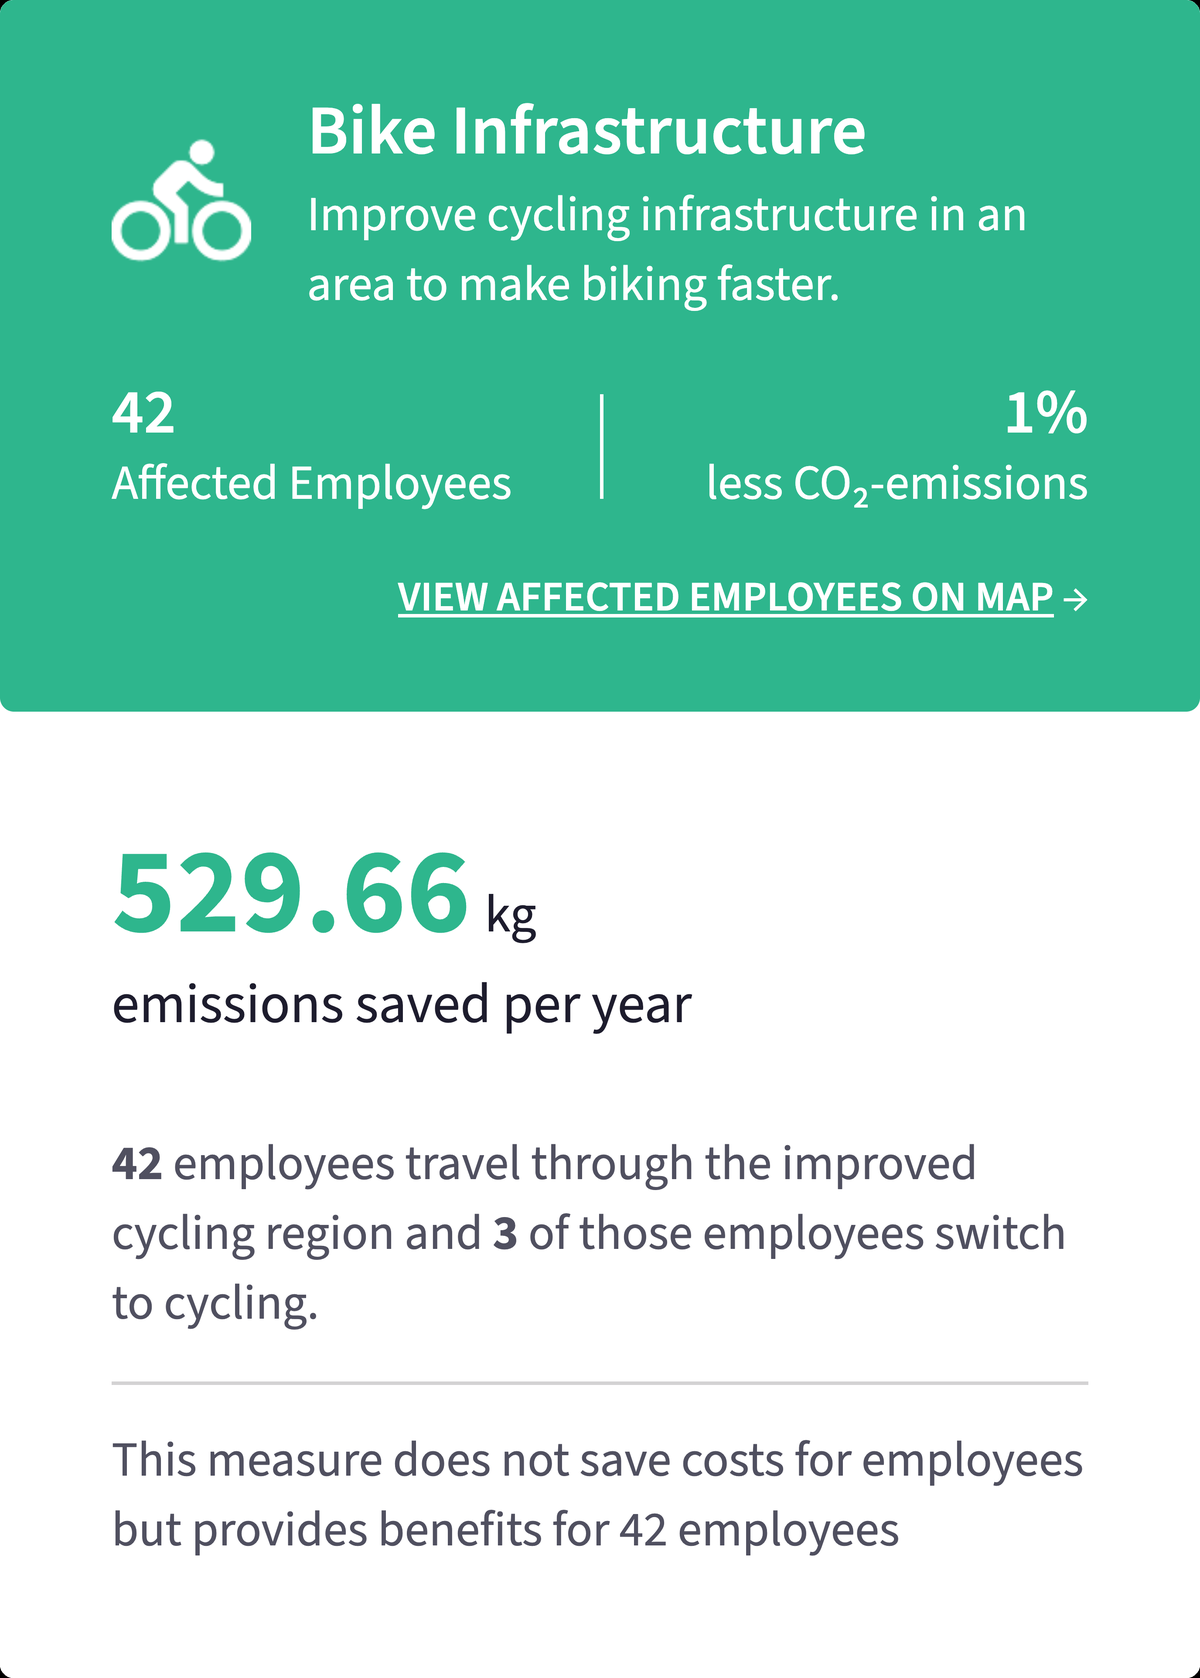
The result card separates the 42 employees affected from the 3 who switch.
What it tells you: the gap between 42 and 3 is the most useful thing on the card. The intervention touches far more journeys than it converts, and this example already ran at the maximum setting. That points to the location, not the level of improvement, as the thing to question. It does not mean the other 39 gain nothing, and the result alone does not explain why they stay with their current mode.
It does point to the next questions. Does the selected area cover the part of the journey that actually discourages cycling? Is the modelled improvement a fair representation of the proposed works? Those are more useful than reading 42 as a forecast of new cyclists.
A mobility hub tackles a different problem: the gap between public transport and the rest of the journey.
In the Mobility Audit, you select stops and a shared last-mile mode, such as bikes or scooters. The option can apply to access (getting to the stop), egress (getting from the stop to work), or both. Shorter connections widen a stop's practical catchment and make the whole public transport journey more competitive, without changing a single timetable.
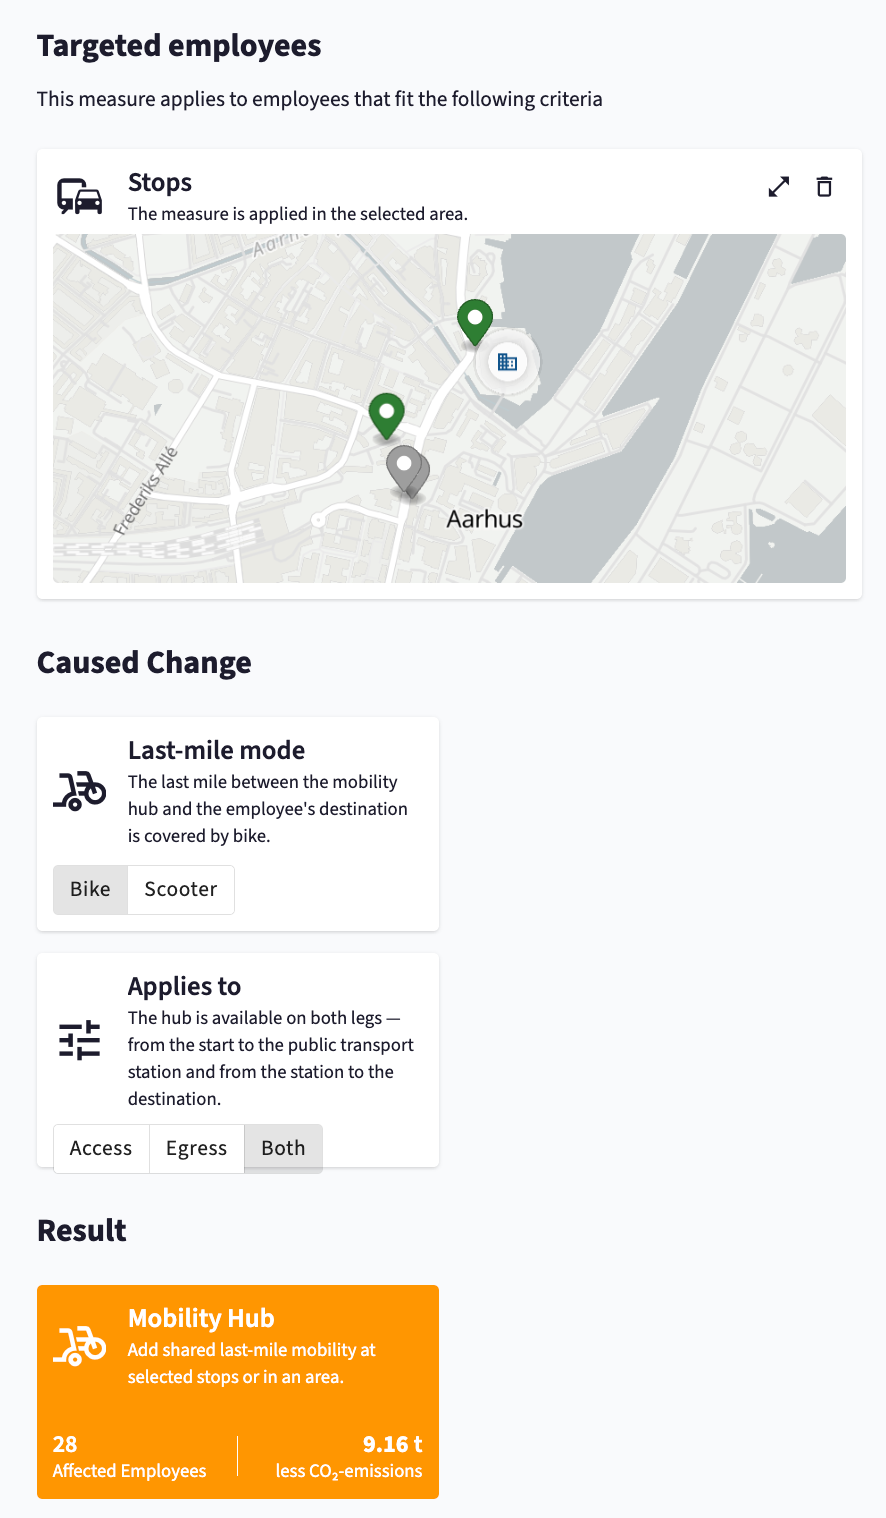
Setting up the hub: selected stops, shared bikes as the last-mile mode, available on both legs of the trip.
Modelled result:
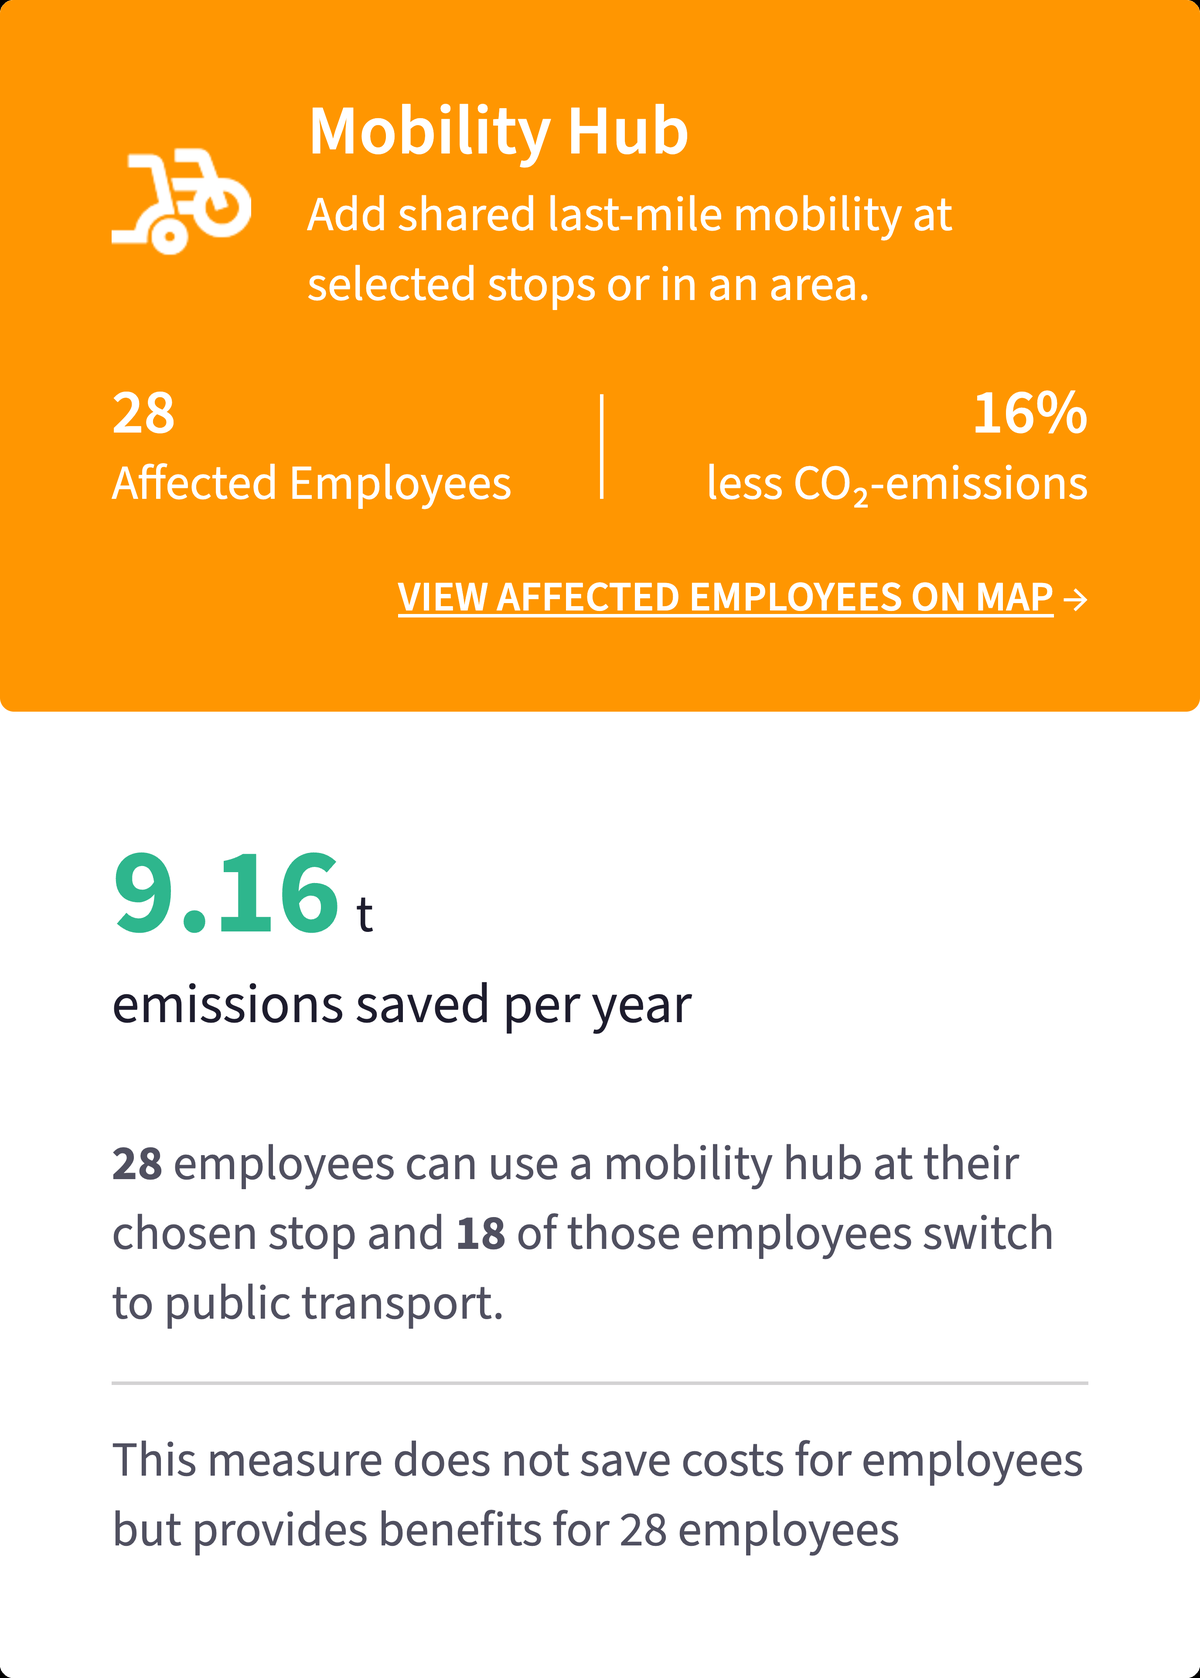
Here 18 of the 28 affected employees switch to public transport.
What it tells you: here most affected employees are estimated to switch. In this scenario, the first and last mile look like the real constraint on these commutes.
Before relying on the estimate, check what the model does not settle: whether a service could run at those stops, physical access, and operating arrangements.
Start with the assumptions most likely to change the conclusion:
Where you can, rerun the scenario with alternative plausible settings. If a reasonable change in assumptions flips the decision, you have learned something important.
Keep a short decision record: the baseline, intervention settings, data period, key outputs and open questions. If you test an alternative location, record what changed between the scenarios. It is the same discipline that makes commute emissions audit-ready.
Finally, decide now how you will judge the result later. Note which journeys and KPIs should change, how you will observe them, and what else might change in the meantime. A scenario is a hypothesis; measuring the impact after implementation is the test.
CITWIN is a European research project under the Driving Urban Transitions (DUT) Partnership, developing a generic digital twin framework. It models changes to active transport infrastructure and evaluates how they contribute to the 15-minute city, with Aarhus and Eskilstuna as its urban living labs.
triply's contribution brings the employer's view to that work: combine base data with employer and employee data, assign routes to employees, and compare scenario KPIs against a baseline.
To be precise about status: walking infrastructure, cycling infrastructure and mobility hubs are implemented in the Mobility Audit. The organisational scenarios designed for the project are specified but not yet implemented, and changes to public transport lines and schedules are at concept stage.
Two things this is not. It is not a continuously updated, city-wide digital twin operated by triply. And it does not require every employee to have a 15-minute commute; the point is to connect urban interventions to the journeys a real workforce makes.
The framework combines digital twin base data, employer and employee data, and a defined intervention. The exact requirements depend on the project, so agree the journey, workplace, schedule and baseline data with the modelling team before you start.
No. An employee can benefit from an improved option and still have another mode as their modelled choice. In the cycling example, 42 employees were affected and 3 were estimated to switch. Report the two numbers separately.
Yes. A shared last-mile option can shorten the trip to or from a stop, which changes the complete journey. The size of the effect depends on the stops, the workforce and the assumptions, and uptake is not guaranteed.
No. They are estimates against a baseline under stated assumptions. Measured savings need evidence after implementation. When you publish a modelled figure, keep its status, reporting period and unit next to it.
They can tell you what deserves a closer look. Choosing an investment also depends on build and operating costs, feasibility, service conditions, uncertainty and your organisation's objectives. Neither example includes an infrastructure ROI calculation.
The best place to start is a proposal concrete enough to model: a cycling upgrade in a defined area, or shared bikes at specific stops. Name the constraint it is meant to fix, compare it against your baseline and use the result to decide what to investigate next.
For a real-world example, see how Ringana redesigned commuter mobility for 450 employees.
If your organisation is weighing a change like this, talk to triply about modelling it in the Mobility Audit against your own workforce's commutes.

It tests a proposed transport change, like a cycle route or a mobility hub, against a baseline before anything is built. For employers, it applies the change to real employee commutes and compares the result on cost, travel time, distance, modal split and emissions.
Walking infrastructure, cycling infrastructure and mobility hubs. Organisational scenarios have been specified but not yet built, and changes to public transport lines and schedules are still at concept stage.
Five: cost, travel time, distance, modal split and emissions. Modal split can be shown by main transport mode or by person-kilometres. The first shows how many people use a mode; the second shows how much of the total distance it covers.
Check that the selected area or stops match the real proposal and that the modelled change reflects the planned works. Check that the workforce data matches the commuting patterns in question. Rerun the scenario with other plausible settings: if a reasonable change flips the result, the decision needs more work.
CITWIN is a European research project under the Driving Urban Transitions (DUT) Partnership. It is building a digital twin framework for active transport, with Aarhus and Eskilstuna as test cities. triply adds the employer’s view: it combines base data with employer and employee data, assigns a route to each employee, and compares scenario results against a baseline.