Model demand, routes, and costs before contracting operators to optimize load factor, cost per rider, and Scope 3 commuter emissions.

If you sign a bus contract before you model demand, routes, and service levels, you risk paying for the wrong network. At Mexican plants, staff transport affects shift coverage, attendance, cost control, and emissions reporting. And in places like Ciudad Juárez, the market is large: about 75,000 workers per day move across 3,500 vehicles, while about 63% of registered permits are said to fall short of legal rules.
Here’s the short version:
A simple rule runs through the whole piece: model first, contract second. That gives you a clearer basis for route design, pricing talks, service KPIs, and emissions reporting across one plant or several plants.
| Area | What I check first | Why it matters |
|---|---|---|
| Demand | Home-area clusters and shift windows | Shows where bus service can work |
| Route design | Direct routes vs loops | Changes trip time and rider uptake |
| Bus sizing | Seats vs expected riders | Affects load factor and cost |
| Procurement | Fixed-price vs variable terms | Changes risk if demand is uncertain |
| Reporting | Scope 3 Category 7 baseline | Sets the starting point for commuter emissions |
| After launch | Actual boardings by stop and shift | Shows what to cut, merge, or expand |
If you want fewer weak assumptions in contract talks, you need route modelling before any operator quote is signed.
Before you map a single route, get clear on what the program needs to deliver at each plant.
Start with the goals. That means on-time arrivals, full shift coverage, and enough flexibility to handle overtime or shift changes without throwing service off track. It also includes contractor demand, safety, reliability, and cost control that procurement and finance can track.
These decisions give you the baseline for route modelling before talks with any operator begin.
Pick your core metrics before route design starts, then stick with them. triply uses the same definitions to compare route scenarios before contract terms are locked in.
Those definitions become the inputs for route modelling, load factor, and cost simulation. Once goals and metrics are fixed, you can turn workforce and shift data into demand corridors.
You don’t need a huge data project to start. In many cases, the HR, payroll, or attendance data you already have is enough. Use datengesteuerte Einblicke from employee home-area data by postal code or municipality, shift patterns, plant entrance locations, and any boarding records already on file. With that, you can map demand at route-planning level and spot where charter bus services are likely to work.
The next step is to group employees by home area and match each cluster to plant shifts. This turns scattered workforce data into a route map you can use before contract talks begin. The point is simple: find the commuting corridors where enough employees travel in the same direction at the same time to support a charter bus.
Some patterns stand out fast:
That gap matters early. It helps you avoid going into operator discussions with weak assumptions or route ideas that won’t hold up once pricing starts.
You can use triply at this stage. It models commutes from minimal data and pulls HR, payroll, and attendance records into one planning view. Instead of treating each plant as a separate exercise, you can model all plants in one view. That makes it easier to compare sites, spot shared patterns, and plan at network level.
It also lets you estimate simulated uptake: how many riders are likely to board a proposed service based on home locations and shift times. That gives you a defensible demand baseline for operator discussions [1][2]. You can then use that baseline to size routes and schedules in the next section. This is the first step in modelling routes before you contract.
Start by finding the postal codes with the highest employee density in each corridor. These are your anchor pickup zones. From there, group nearby pickup points into short, direct routes. The logic is simple: detours eat up travel time.
It also helps to split routes by shift window. A corridor that fits one shift start might not work at all for another. So treat each shift window on its own, and match the bus plan to the people who are actually travelling at that time.
Once the stop pattern is set, you can turn that route into a working schedule.
Begin with the required arrival time. Then add gate time, such as security checks or badge scanning, and add route travel time to work backward to the first pickup. If the route crosses busy junctions or industrial access roads, add a small buffer for normal traffic variation.
That schedule becomes the basis for testing bus size and cost per boarded rider.
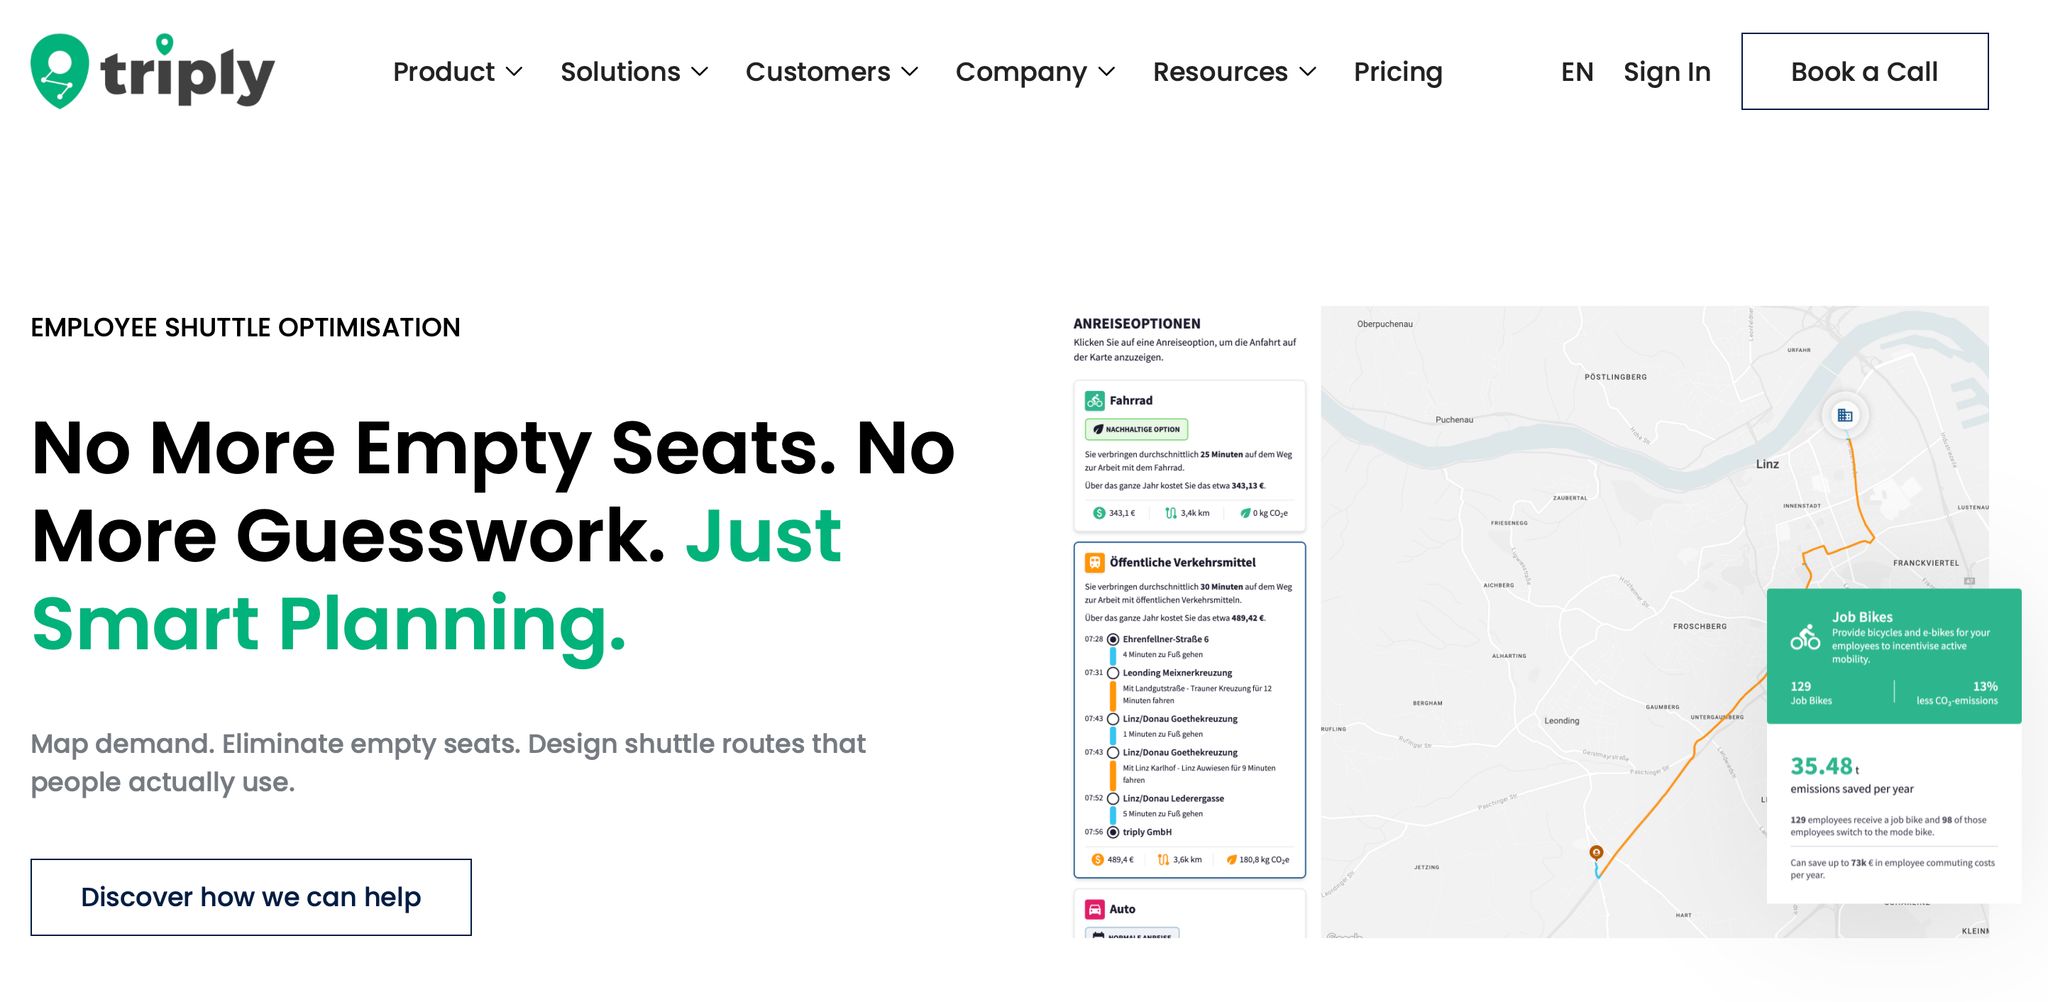
Before pricing talks start, you need to know which route options are worth pricing and what they do to your load factor.
In triply, you can simulate stop spacing, direct routes versus multi-stop routes, and bus size. Change the stop pattern or the vehicle size, and both the expected load factor and the cost per boarded rider will change too. That means you can test the trade-offs before they show up in a quote.
This step also gives you a side-by-side view of a direct route and a multi-stop route serving the same corridor, with cost, load factor, and estimated uptake for each scenario. Use the scenario you prefer to set the commercial terms in the next step.
Once you’ve built the route scenarios from Section 3, you can use them to see which cost drivers will shape contract pricing the most. The main ones are vehicle-hours per shift, total route distance, peak vehicle requirement, empty running distance, load factor, and cost per boarded rider.
Each of these moves in a different way when you change the route design. A direct route might cut distance and empty running, while a loop might serve more stops but add time and cost. If you test these combinations in triply before procurement starts, you go into operator discussions with a much clearer picture of the trade-offs. That matters, because you’re not handing all of that analysis over to the operator.
Cost figures at this stage should be used as illustrative ranges, not fixed targets.
Broad promises like on-time buses sound fine, but they’re hard to enforce if nobody has defined what on time means. Model-based KPIs work better because they come from the route design and shift setup you’ve already tested.
From your triply model, you can set contract targets such as:
These are much easier to turn into contract service levels than vague promises. If live performance drops below the load-factor band or goes above the cost ceiling you modelled, you have a clear basis for review or renegotiation.
The same model can also set your Scope 3 Category 7 baseline. Before launch, it gives you a baseline emissions estimate for each commuting corridor. That figure becomes the starting point for Scope 3 Category 7 reporting. It also gives you a defensible baseline for your broader CSRD and ESRS E1 workflow, if those rules apply to your organisation.
The table below compares the route and contract options that matter during procurement. All bands are illustrative and will vary by plant location, workforce density, and the local operator market.
Use these outputs to pick the contract structure that fits your demand risk.
Route scenarios
| Dimension | Direct route | Multi-stop loop |
|---|---|---|
| Expected load factor band | High | Moderate |
| Cost per boarded rider band | Lower, due to fewer vehicle-hours per rider | Higher, due to longer route per rider served |
| Scope 3 Category 7 baseline | Lower emissions per rider if load factor stays high | Higher emissions per rider if load factor stays low |
| Flexibility for route changes | Lower, optimised for one corridor | Moderate, stops can be added or removed |
| Risk of paying for low-usage trips | Lower if demand model is accurate | Higher if dispersed demand does not materialise |
| Best use case | When corridor demand is confirmed and stable | When demand is spread and still being validated |
Contract structures
| Dimension | Fixed-price contract | Variable contract |
|---|---|---|
| Expected load factor band | N/A | N/A |
| Cost per boarded rider band | Predictable, but carries risk if demand is lower than modelled | Scales with actual usage, lower risk if uptake is uncertain |
| Scope 3 Category 7 baseline | Emissions baseline set at contract start | Easier to adjust as demand data matures |
| Flexibility for route changes | Lower, changes require formal amendment | Higher, scope adjusts with usage |
| Risk of paying for low-usage trips | Higher if minimum volumes are guaranteed | Lower, but unit costs may be higher |
| Best use case | Once you have enough real boarding data | Better suited to the pre-data or early-launch phase |
Once the programme is live, you finally get the thing every planner wants: real operating data.
Track boardings by stop, load factor by trip and shift window, and on-time arrival against shift start. That gives you a much clearer view of what’s working and what’s not.
If a stop keeps showing low usage, that’s a sign it may need to be merged with another stop. If a corridor is filling up faster than the model expected, that’s a strong signal to add capacity before the next contract period, not after the service starts straining.
Then feed that data back into your triply model. This helps correct weak assumptions, tighten planning, and spot growing commuting corridors early.
Use those live results to test changes before you amend the contract.
A stop removal may look like an easy cost cut on paper. But the knock-on effect can be messy: it can lower load factor on a linked trip and push up cost per boarded rider. That’s the kind of change that looks good in isolation and weakens the full network.
At renewal, operators will price the next term based on scope. So don’t walk into that discussion with gut feel alone. Bring modelled scenarios that show the effect of each change on:
As real boarding data builds up over time, your Scope 3 Category 7 baseline gets firmer too. That gives sustainability reporting a stronger base through continuous recalibration from live data.
Model before you contract, then keep the model live after launch.
triply supports initial commute modelling, route and schedule simulation, and Scope 3 Category 7 reporting. If you’re planning or reviewing a charter bus programme at one or more large plants, book a demo with triply.