
Model commutes before site approval to cut transport costs, secure shift attendance, and simplify Scope 3 Category 7 reporting.

If workers cannot get to the plant on time, the site plan is weak from the start. For automotive suppliers in Mexico, mobility should be treated as an early investment check, not a late HR task. Before hiring is complete, you can already test commute risk, shift coverage, transport cost, and Scope 3 Category 7 reporting with a small set of inputs.
Here’s the short version:
In Mexico’s automotive supplier hubs, industrial parks are often a long way from where workers live. That distance isn’t a side issue. It shapes the whole transport plan.
Start by mapping worker home zones against the plant location. That gives you a clearer view of which routes will carry actual demand, not just theoretical coverage.
A lot of supplier plants sit outside direct public transport links, so the gap between the plant and home becomes the main driver of route design. And demand across the local workforce catchment is rarely even. Some residential zones send a high number of workers in the same direction. Others are more spread out, which can make route planning messier and more expensive.
Geography sets the stage, but shift work is what turns that map into cost. Staggered start times, early shifts, and night shifts all shape transport demand in very different ways. That’s why you need to model shift windows against the local road network and public transport links.
This matters because shift patterns directly affect the expected load factor on each route. And once load factor changes, cost per boarded rider changes with it. Put simply: a bus that looks fine on paper can become expensive fast if shift timing spreads riders too thin.
When you know which zones and shift windows are driving demand, you can measure load factor, cost per boarded rider, and route viability with far more confidence.
Once routes and shift windows are mapped, you need a shared scorecard. If every team works from its own assumptions, route options, subsidy levels, and shift-time changes become hard to compare.
Four metrics do most of the heavy lifting for route design, shift timing, and transport spend.
These metrics give each function the same view of the plan. Finance can compare subsidy levels across route designs. Operations can check whether a shift timing change lifts load factor without adding cost. Sustainability can compare emissions across route and shift scenarios.
That same dataset also supports emissions reporting.
Employee commuting sits under Scope 3 Category 7 in the GHG Protocol framework. To report it well, you need a method that matches the data you actually have. The simplest way to do that is to use one commute model for both investment decisions and Scope 3 Category 7 reporting.
You do not need a complete workforce file to get started.
Before go-live, full workforce data is rare. In most cases, you work with what is available: site location, planned shifts, expected headcount, local commute patterns, and proxy data where workforce data is missing.
The key is to separate observed inputs from estimates. That way, you can update the model as staffing grows instead of rebuilding it from scratch. It keeps the model usable from the first planning stage through full operations, which is exactly when pre-investment commute modelling delivers the most value.
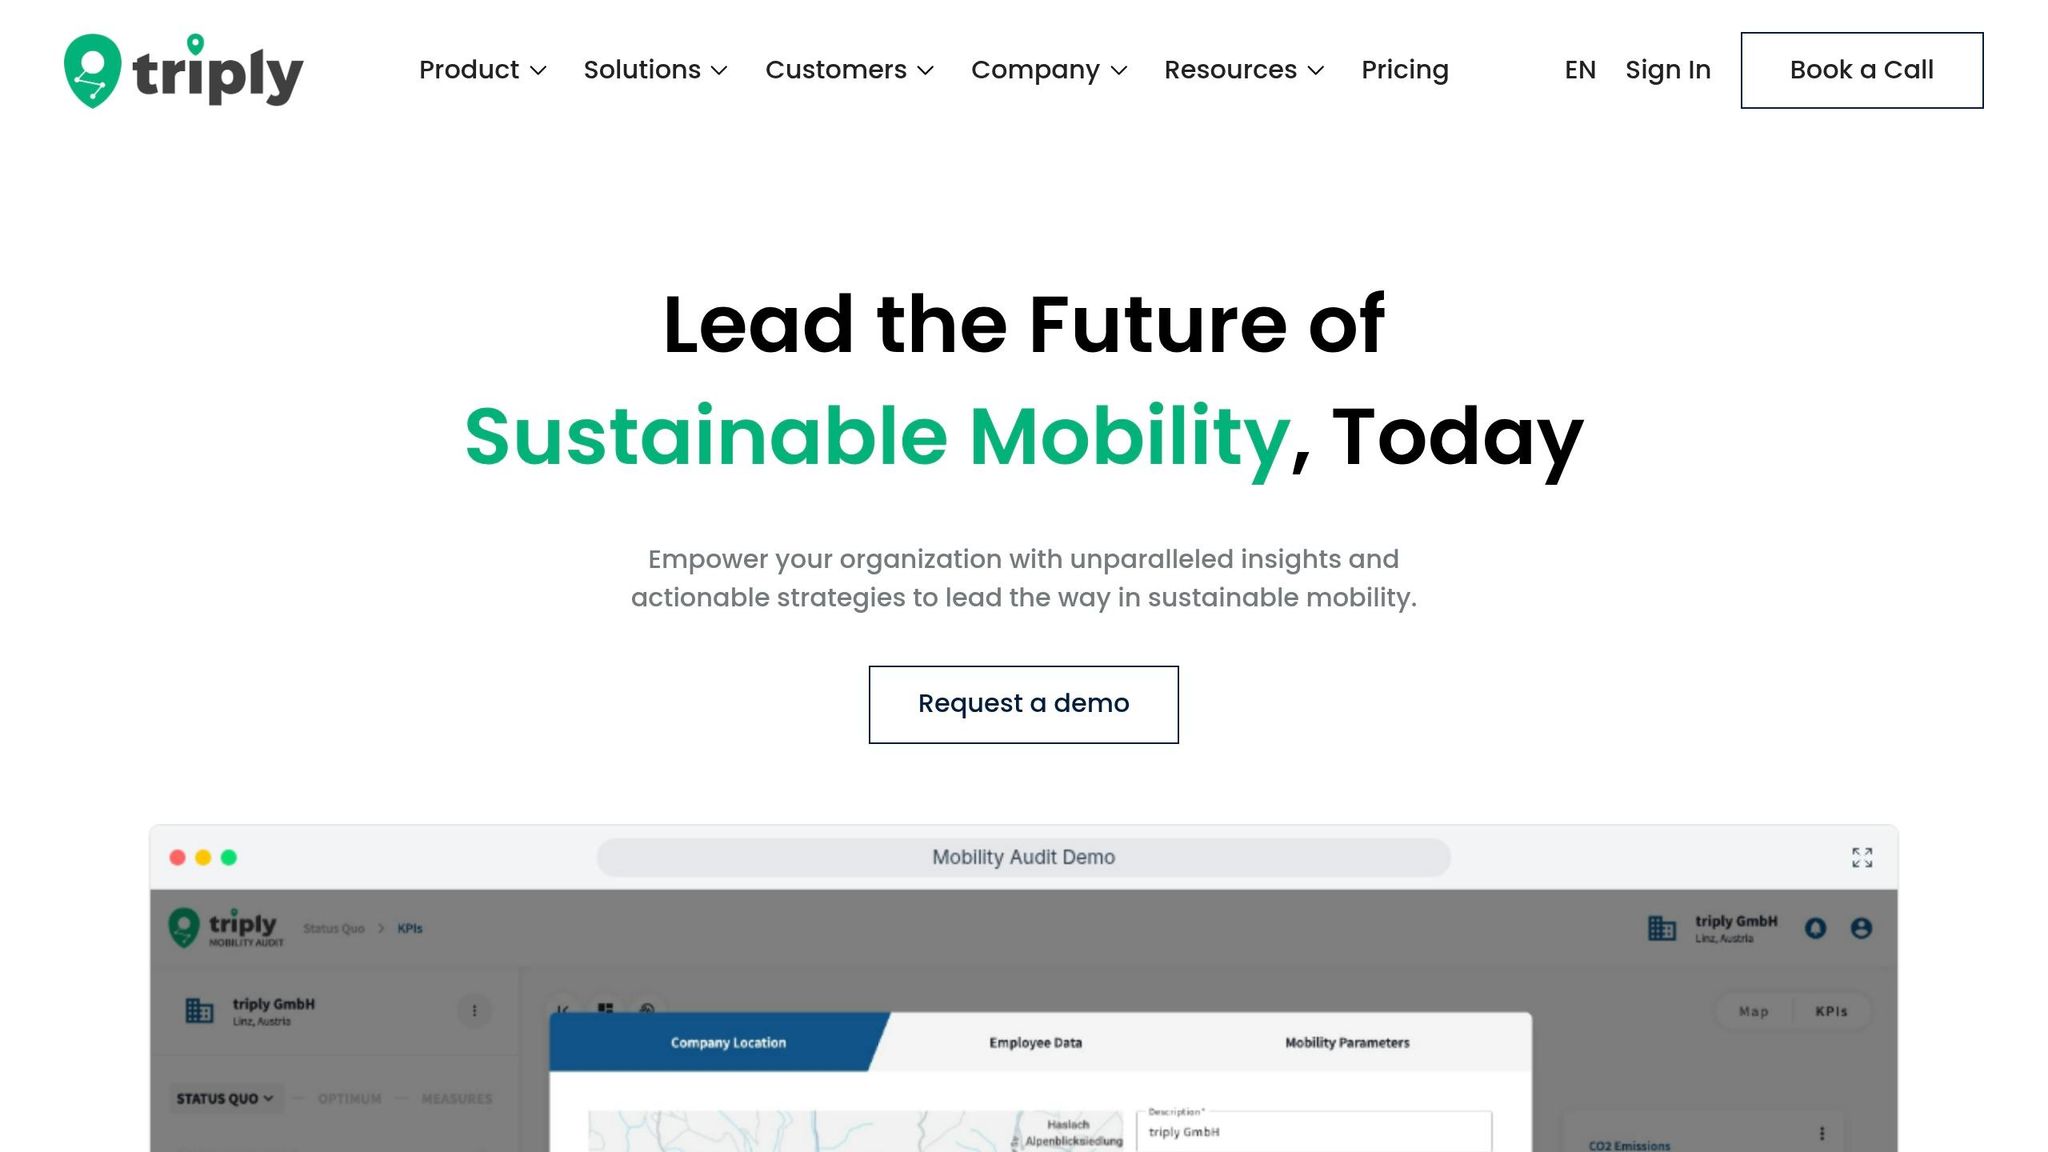
Use those inputs to build your first commute model. triply takes you from early planning data to an investment case and Scope 3 Category 7 reporting. That helps you check whether a site can meet shift attendance, transport cost, and emissions targets before it gets approved.
Start with the base case. Then test routes, shifts, and reporting outputs against that same setup.
triply builds a commute model from a small set of inputs: employee postal codes, site location, and shift patterns. That’s a big deal in a nearshoring setup, where workforce data is often incomplete at the planning stage.
Once the inputs are loaded, triply maps commute distances and travel times for the workforce you expect to support. You can spot which postal code clusters sit within a workable commute window and which shift windows create the highest transport demand. As staffing data grows, you can refine the model instead of rebuilding it from scratch.
If you operate more than one site in a Mexican cluster, triply brings them together in one view. Finance and operations get one shared picture across sites, rather than separate spreadsheets built on different assumptions.
Once the base case is ready, you can test mobility measures against the same assumptions.
When the baseline commute model is in place, you can test mobility measures before spending any budget. triply lets you run scenarios for employer shuttles, public transport incentives, carpooling, and flexible scheduling, then compare them using the metrics that matter for your business case.
| Measure type | What you can test | Typical decision question |
|---|---|---|
| Employer shuttle | Route coverage, shift alignment, and boarding demand | Can a shuttle cover the workforce at an acceptable cost? |
| Public transport incentive | Access to stops, mode shift, and subsidy cost | Would a subsidy make public transport practical for enough workers? |
| Carpooling programme | Matching quality, occupancy, and shift overlap | Is there enough shared demand to make carpools work? |
| Flexible scheduling | Shift timing against transport availability | Would different start times reduce transport pressure? |
Running these scenarios before rollout lets you compare cost per boarded rider, load factor, shift-start resilience, and Scope 3 Category 7 emissions side by side. Finance gets a clearer cost case. Operations gets a clearer service case. Sustainability gets a clearer emissions view.
You can also carry those same outputs straight into reporting.
Use one commute model for both scenario analysis and Scope 3 Category 7 reporting. That kind of consistency matters when you're building a case for internal budget approval. Finance, HR, sustainability, and operations all work from the same underlying numbers, which makes cross-functional sign-off much easier.
For guidance specific to your CSRD or ESRS E1 requirements, consult your compliance team directly.
Once the model is built, the last step is governance: assign owners, agree on inputs, and get approval.
Each function looks at the transport plan from a different angle. And each one needs something specific from your commute model before it will sign off.
Finance approves spend. HR checks workforce reach. Sustainability signs off on reporting logic. Operations checks shift readiness.
HR needs to know whether the routes reach the workforce you need. Sustainability needs accurate, consistent data for Scope 3 Category 7 reporting, and it will look closely at how those numbers were produced.
At this point, the question is no longer whether the model works. The question is who signs off on the decision.
The model needs to answer four questions at the same time. Use one model, one dataset, and one set of assumptions. That makes sign-off easier and helps keep finance, HR, sustainability, and operations on the same page.
On larger sites, procurement and EHS may also need to take part.
The next call is how to collect data without slowing the plan down.
| Data Collection Approach | Reliability | Effort | Cost | Suitability for Nearshoring |
|---|---|---|---|---|
| Full survey | High | High | High | Best for established plants with stable workforces |
| Sample survey | Medium | Medium | Medium | Useful for quick pulses in large employer settings |
| Proxy data | Low | Low | Low | Suitable for initial site selection and rough estimates |
| Modelled inputs | High | Low | Medium | Ideal for scenario planning and Category 7 reporting |
For nearshoring, modelled inputs are the practical place to start because workforce data is still incomplete. Then add actual employee data as it becomes available.
The core argument of this playbook is simple: mobility decisions made after the plant opens are harder, more expensive, and riskier than decisions made before.
If you model commute patterns during site selection and ramp-up planning, you can spot problems while there is still time to act.
The metrics in this guide, including cost per boarded rider, load factor, and Scope 3 Category 7 emissions, give finance, operations, and sustainability a shared language for decision-making. Pre-investment simulation lets you test shuttles, public transport incentives, carpooling, and schedule changes before signing any contracts.
triply helps you run this workflow. If you are planning a new site or expanding an existing one in Mexico, book a triply demo and see how far you can get with the data you already have.



