
12 behaviour-focused commute questions (mode, days, times, constraints, postal code) plus modelling to forecast shuttle, parking and transit demand.

Most employee transport surveys fail for one simple reason: they ask what people like, not what they do.
If you want survey answers that help with shuttle planning, parking demand, or public transport support, you should start with 12 behaviour-led questions: current mode, on-site days, travel times, commute length, regular stops, schedule limits, parking access, public transport fit, carpool fit, switch triggers, likely use of a specific offer, and home postal code area. Those questions are far more useful than a 1-to-10 satisfaction score.
Here’s the short version:
Just as important: survey data alone is not enough. It gives you a starting point, but not a forecast. To test whether a shuttle route, parking policy, or transit support will work before spending €, you still need commute modelling.
Quick comparison
| Question type | What it tells you | Signal strength |
|---|---|---|
| Current commute mode | What employees do now | High |
| On-site frequency | How much travel demand exists | High |
| Travel times | Whether schedules line up | High |
| Regular stops and work limits | Which options are ruled out | High |
| Home PLZ area | Where routes cluster | High |
| Conditional switch question | What may change behaviour | Medium-high |
| Satisfaction score | How people feel | Medium |
| Aspirational question | What sounds nice in theory | Low |
So if you want survey questions that predict behaviour in Germany, you should focus on past behaviour, fixed limits, and clear conditions for change - then use modelling to turn those answers into route and budget decisions.
Satisfaction questions tell you how employees feel about their commute. Current commute questions tell you what they actually do.
That difference matters more than it may seem. A satisfaction score gives you sentiment, but it doesn't tell you which mode someone used, when they left home, or whether they had to fit in regular stops like childcare, school drop-off, or errands. And those are the details that shape planning for shuttles, parking, and public transport.
"By understanding how most of your commuters are getting to work, you can also pinpoint the other modes they are most likely to use." [1]
A good way to get clearer answers is to pair a behaviour question with a constraint question. For example, ask: "What mode did you use on your last on-site day?" Then follow up with: "What would need to change for you to switch?" One tells you the current baseline. The other shows where change may be possible and where it probably isn't.
The table below shows what each question type gives you and how you can use it.
| Question type | What it captures | Planning value |
|---|---|---|
| Satisfaction rating | Employee sentiment | Low: does not explain current mode choice |
| Current commute mode | Current behaviour baseline | High: anchors all further analysis |
| Stated barriers to switching | Perceived constraints | High: reveals realistic change potential |
| Regular stops on the way to work | Fixed constraints | High: filters out impractical alternatives |
The next questions build on this idea and narrow in on the commute signals you need to collect. Start with the strongest signal: the commute mode used on each on-site day.
Use this question to track how people get to work on the days they come on site. It gives you a baseline you can compare against work schedule and weekly attendance. This isn't just another survey question. It's the main variable for modelling. Start with this baseline, then line it up with days per week and departure times.
Kathryn Hagerman Medina, Head of Success and Marketing at RideAmigos, puts it this way [1]:
"What has been your primary mode of commuting over the past year? This is the single most important question to establish a baseline understanding of commuter behaviors."
The answer tells you which mode leads today and where a change is most likely. That's why this question works best when you pair it with how often people are on site.
Its planning use is simple: it gives you a measurable baseline. Without that starting point, you can't tell whether a transport change actually shifted behaviour.
On-site frequency shows how demand changes across the week. It gives you a base for demand, mode shift analysis, and programme sizing. In plain terms, this question connects how people travel now with how much demand is there.
Hybrid schedules can change demand a lot from one day to the next. So a five-day shuttle plan or parking setup might be too big on some days and too small on others. People who come in only a few days each week often have commutes with extra stops, like childcare or a school drop-off. That can make switching transport modes much less likely. People who are on site most days face a different issue: if the commute is long and draining at that frequency, it can turn into a retention risk.
This data also helps you spot unused capacity and set a post-change baseline. If a shuttle runs every workday but many employees are only on site part of the week, load factors may stay low on quieter days. That baseline matters later. Once you roll out something new, like a revised shuttle timetable, a parking cash-out programme, or public transport support, you need a clear point of comparison.
Use this answer to send employees to the right follow-up questions. After frequency, the next signal is timing.
Once you know how often employees are on site, the next step is simple: ask when they travel.
This helps you check whether the commute lines up with actual working hours. A lower-cost option can still be a poor fit if it adds too much time to the trip.
The timing pattern also shows where shared arrival and departure windows group together. If many employees travel during the same period, it becomes much easier to spot where a shuttle stop, staggered start time, or small schedule change could have the biggest effect.
Long total commute times can also increase attendance risk. That makes this timing data directly useful for schedule planning.
These time ranges create a baseline for comparing shuttle timetable changes, flexible start hours, and public transport support against current travel times [1].
Once you know when employees travel, the next step is to ask how far they travel.
Distance and travel time tell you different things. Distance shows which other travel modes are physically possible. Travel time shows whether employees are likely to use them.
In practice, travel time often matters more than distance. If a commute already takes a long time, most employees won’t switch if public transport adds too much extra time. But some may still go for carpooling or a direct shuttle. That’s the key point: a transit subsidy won’t change behaviour if time, not cost, is the main barrier.
This answer helps you group employees by route feasibility before you test shuttle, parking, or carpool options. The most common commute profile at your site can point you toward what to test first, whether that’s a shuttle route or support for carpooling.
Next, ask about regular stops that can rule out mode changes altogether.
Use this question to spot fixed stops that make a mode switch unrealistic. On paper, the time and distance might look fine. But in day-to-day life, those set stops can shut the door on a shuttle or carpool.
A childcare or school stop can make driving the only option that works, even if a shuttle is available. This is trip-chaining: home to school to work, or work to supermarket to home. Once you add another mode into that chain, the whole route can get awkward fast. That’s why employees with trip-chaining needs are often the least likely to switch away from a personal vehicle.
This question helps you separate likely shuttle or carpool users from employees whose routes are locked in. That way, you don’t overstate demand.
When you phrase the question, keep it simple. Ask:
That gives you useful data without asking for private details.
You can also use this split to flag which employees should get the next question about work-schedule constraints.
If regular stops already rule out some travel options, the next step is to look at work schedule constraints.
Ask employees to pick the single issue that affects them most:
This gets to the real reason behind a commute choice. And it helps you see whether a fixed-schedule shuttle is even a realistic option.
Use this question to separate employees who can change modes in practice from those who can't. If timing isn't the thing blocking change, the next question is which parking access employees use today.
Ask employees which kind of parking access they use today. This gives you a clear view of how tied they are to driving. Parking access often shapes travel choice more than people think.
Let employees pick one option: free on-site parking, paid on-site parking, street parking, park-and-ride, or no on-site parking. That single answer helps you judge how realistic a shift to another mode may be.
| Parking Type | Signal for Transport Planning | Shift Potential |
|---|---|---|
| Free on-site | Strong dependence on driving | Low, unless incentives are high |
| Paid on-site | High cost burden for the employee | High, if cheaper alternatives are provided |
| Street parking | Lack of on-site capacity; high stress | High, if a more convenient option exists |
| Park-and-ride | Employee is already open to multi-modal transit | Very high for improved transit links |
| No on-site parking | Usually already using transit, walking, or cycling | N/A (current baseline) |
Use this answer to separate employees who are locked into driving from those already open to shared or multi-modal travel.
Next, test which public transport options are actually available on each route.
Once you've looked at parking access, the next step is public transport. But this isn't just about whether there's a stop nearby on a map. It’s about whether transit is actually usable for that route day to day.
An employee might live close to a station and still not have a workable option. Maybe the walk or cycle to the stop is poor. Maybe the last stretch from the stop to your site is awkward. Maybe the service simply doesn’t line up with their shift times. On paper, transit exists. In practice, it doesn’t.
Ask employees to name the main reason they don’t use public transport now. Common answers include:
Each answer points to a different fix. You’re not dealing with one generic “transit problem”. You may be looking at route gaps, long travel times, infrequent service, missed connections, high fares, or poor access at either end of the trip.
If journey time is the main issue, a fare subsidy won’t change much. The fix needs to match the constraint.
Past behaviour matters too. People are more likely to use transit modes they already know and trust. That’s why the answers should help you tell the difference between a route that is merely available and one that is genuinely usable.
Use this input to separate employees who are real public transport candidates from those whose routes still call for car, shuttle, or carpool options.
This question shows whether a shared-car option is realistic for each employee right now, given their current limits. In plain terms, the answer tells you if carpooling can work under current conditions.
A no only means something useful if you also know why. Is the problem the route, the schedule, or the person's willingness to share a ride? Those are very different issues, and they need different responses.
Some blockers are worth separating out:
Each one points to a different planning move. If the blocker comes from attitude rather than logistics, that matters too. That makes this answer useful for both mode-shift screening and route clustering.
Use this answer alongside home postal codes to spot routes where carpooling is actually feasible.
Once you've mapped current habits and limits, the next step is simple: ask what would actually change the choice.
This question gets to the real trigger behind a mode switch. For some people, it's time. For others, it's cost, access, or day-to-day flexibility. That's the change point you're trying to find.
Here's why that matters: if commute length is the main barrier, a cost-only incentive won't change behaviour.
The answers help you see what's getting in the way:
That points you toward the right measure. In practice, that helps you choose between things like a shuttle, parking changes, or schedule changes.
You can also use the answers to group employees by their most likely switch trigger and compare switch potential after an intervention. So this isn't just a measurement step. It's a rule for segmentation later in your modelling.
Next, ask whether employees would actually use a specific offer if it were available.
Once you know what would need to change, the next step is simple: ask if a specific offer would change the person’s commute.
That means asking whether an employee would use a shuttle, subsidy, or schedule change under their actual commute conditions. This gives you a much better signal than asking if they like the idea in general.
A direct follow-up makes the picture clearer. It shows which condition would shift behaviour and which one won’t. If you lead with cost savings but the main barrier is travel time, you’ll end up overstating how many people might switch.
"If the length of the commute is the primary consideration for your commuters but you've built a program that advertises cost savings, you're not reaching the most important point of appeal." - Kathryn Hagerman Medina, Head of Success and Marketing, RideAmigos [1]
This is where stated interest and likely action can drift apart. Someone may say a shuttle sounds good, but if it adds 20 minutes each way, that offer probably won’t change much in practice.
A company-car study cited here found that some drivers required very high monthly compensation to switch. That points to how strong set travel habits and preferences can be. [2]
Use these answers to split employees into groups:
That split helps you decide which responses should feed into shuttle, subsidy, or schedule modelling.
Ask for the home postal code area (PLZ), not a full address. That keeps the question less sensitive and often gets more people to answer.
PLZ data shows where commuters live, which routes tend to cluster, where public transport service is weak, and where parking pressure is likely to stay high. That matters because employees in areas with poor public transport links can be harder to move away from solo driving. In plain terms, this helps you judge whether a public transport subsidy is likely to work before you roll it out.
These postcode clusters also feed directly into planning for carpooling, shuttles, and parking.
For carpool planning, employees who live in the same or nearby postal code areas can be good matches, even if they’ve never said they want to carpool [1]. For shuttle planning, geographic clusters show where a stop would serve actual demand, not just where it would be easy to run one.
Use these clusters to turn survey answers into shuttle, parking, and public transport scenarios.
Use the answers to make three planning calls: shuttle, parking, and public transport. These survey results feed into pre-investment commute modelling. They are inputs, not the final answer. The simplest way to work with them is to sort responses by the decision they support.
For shuttle planning, look at postal code clusters, arrival windows, and on-site days together. That helps you test stop locations and time windows as one system, not as separate parts. For parking, compare current parking access with switch triggers. That shows where parking-demand reduction is most likely to work. For public transport, line up realistic availability from Q8 with distance and travel time from Q4. That makes it easier to judge whether a fare subsidy or a route change is the better move.
Use this mapping as a quick reference when you build shuttle, parking, and transit scenarios.
| Planning decision | Most relevant questions |
|---|---|
| Shuttle stop location | Q12 (postal code clusters), Q3 (arrival times), Q8 (public transport gaps) |
| Time windows | Q2 (on-site days), Q3 (travel times), Q6 (schedule constraints) |
| Parking-demand reduction | Q7 (current parking access), Q10 (mode-switch conditions), Q11 (incentive uptake) |
| Public transport support | Q8 (realistic availability), Q4 (distance or travel time) |
| Carpool and feeder routes | Q12 (nearby postal code areas), Q9 (carpool openness), Q3 (time windows) |
Treat the first survey as your baseline. Next, sort the questions by signal strength.
Not all questions are equally good at predicting what people will do. The strongest ones focus on past behaviour, hard constraints, and clear conditions for change.
Use the ranking below to see which answers should shape planning and which ones mainly add background.
| Question Type | What it Reveals | Predictive Strength |
|---|---|---|
| Behavioural baseline ("What is your primary commute mode on each on-site day?") | Actual habits and the most likely alternative modes to adopt | High |
| Constraint-based ("Do you have childcare drop-offs?") | Non-negotiable barriers that rule out certain modes entirely | High |
| Home postal code area | Realistic distance and route options via modelling | High |
| Arrival and departure times | Peak demand windows and schedule viability | High |
| Conditional intent ("Would you use X if Y was offered?") | Specific triggers needed to shift mode | Medium-high |
| Satisfaction scale ("Rate your commute 1 to 10") | Current pain points, but not which alternative gets adopted | Medium |
| Self-estimated commute distance | Subjective perception, often inaccurate | Low |
| Aspirational ("Would you consider using a shuttle?") | General interest, not grounded in real-world constraints | Low |
The weakest signals usually come from aspirational or self-estimated answers. Aspirational questions tend to measure polite intent more than actual behaviour, because they don't make people test an offer against their real schedule or trip limits. That's why behaviour questions are more useful than satisfaction questions.
A small wording change can make a big difference. Use conditional questions instead of vague interest questions. For example, "Would you use a shuttle if it matched your arrival time and route?" gives a stronger signal than "Would you consider using a shuttle?"
The same logic applies to commute distance. Self-estimated commute distance is weak because people often guess wrong. Home postal code area is stronger because it supports route and transit modelling.
This ranking leads into the next step: combining survey answers with site data to test shuttle, parking, and public transport options.
The main blind spot is benefit awareness. If employees don’t know that commute benefits already exist - like mobility subsidies or secure cycle storage - their stated willingness can make future uptake look higher than it will be in practice. And that matters, because a stated preference is not the same thing as route feasibility.
Survey answers give you a baseline. But they don’t show which changes will actually shift behaviour. That’s why it makes sense to repeat the survey from time to time, so that baseline stays current.
This is the gap that pre-investment commute modelling fills. It turns survey answers into practical decisions around shuttles, parking, and public transport.
This is general information only, not legal or tax advice.
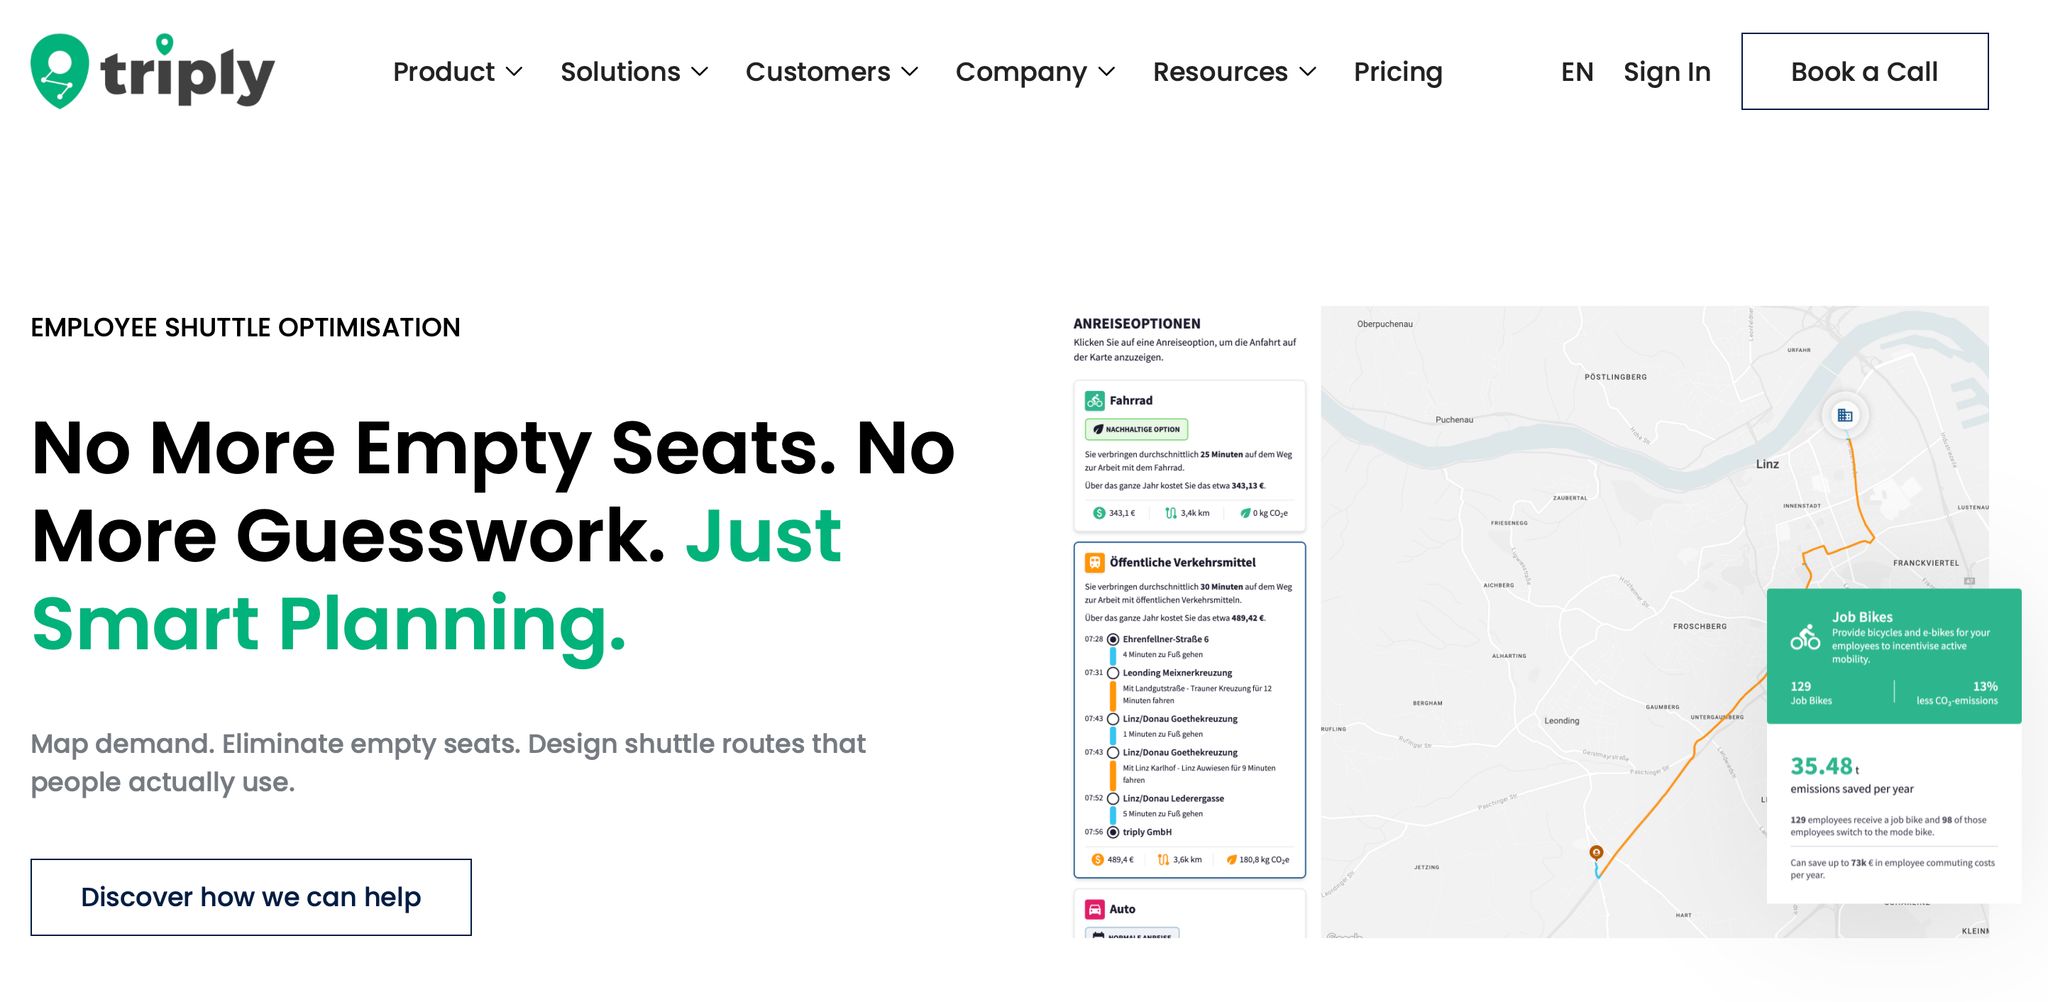
Your employee transportation survey questions give you the baseline. But by themselves, they don't give you a forecast. triply closes that gap by turning survey answers into route-level scenarios.
Using postal codes and shift patterns, triply models actual commute patterns from basic operational inputs without surveying every employee. That means you can test carpool feasibility before you put money into matching. [1]
Once you have the baseline, the next step is simulation. Before you commit budget to a shuttle route, public transport support, or a schedule change, triply estimates:
For employers with more than one site, the platform brings data from all locations into one dataset, so teams work from the same numbers across sites.
triply also outputs Scope 3 Category 7 figures aligned with CSRD and ESRS E1. So finance, sustainability, and operations can work from one shared dataset instead of separate spreadsheets and assumptions.
If you want to pressure-test your site data, see the employee shuttle optimisation use case. To look at the modelling approach for complex shift patterns, book a demo of the employee shuttle optimisation use case on triply.net.
This is general information, not legal or tax advice.
What are the best employee transportation survey questions to predict real commuting behaviour?
Ask what employees actually do, not how they feel about it. Use: "Ask what employees actually do, why they do it, and what would need to change for them to switch."
How many employee transportation survey questions should you ask?
If you need a minimum viable survey, stick to four core questions:
Can employee transportation surveys predict shuttle demand?
A survey shows interest, not confirmed demand. That distinction matters. Use survey data with modelling to estimate likely uptake before you spend money.
Do you need full home addresses for transport planning?
No. Home postal code areas are usually enough for clustering and privacy. triply models from postal codes and shift patterns without needing individual address data.
Why is low survey participation a problem for transport planning?
Low participation weakens route clustering and can hide a benefit-awareness gap. In plain terms, your data may paint the wrong picture. Treat it as a data-quality warning before you build shuttle or public transport scenarios.
To turn survey answers into shuttle, parking, and public transport scenarios, book a demo of triply's employee shuttle optimisation use case.
The best employee transportation survey questions show what people do now, why they do it, and what might get them to change. Questions on main commute mode, on-site frequency, departure times, actual constraints, and believable switch conditions give you a factual starting point, not a wishlist. The list gives you the signal. Modelling turns that signal into a decision.
But survey data on its own can’t tell you if a new shuttle route is feasible, what it would cost, or how it would affect Scope 3 Category 7 reporting.
That’s where triply starts to add value. triply turns survey inputs, postal code clusters, and shift patterns into simulated scenarios you can compare before you invest. Explore triply's employee shuttle optimisation use case, or book a demo.
This article is general information only and does not constitute legal or tax advice.



