
One shared commute model to test shuttles, carpools and Scope 3 Category 7 emissions before you spend a euro.

If we run transport across several sites, we would shortlist software for planning first, not vehicle dispatch. The main test is simple: can it turn HRIS postcodes and shift data into one commute model, let us test shuttle or carpool changes before we spend €1, and use that same dataset for Scope 3 Category 7 reporting?
Quick comparison
| What is being checked | Put on shortlist | Leave for later |
|---|---|---|
| Multi-site commute modelling | Yes | No |
| Scenario testing before spend | Yes | No |
| Scope 3 Category 7 reporting | Yes | No |
| HRIS and SSO integration | Yes | No |
| Live GPS and ETAs | No | Yes |
| Driver navigation | No | Yes |
| Freight-style route tools | No | Yes |
| Perks and benefit admin | No | Yes |
That’s the core point of the piece: for multi-site employers, the right software helps me model, compare, and report from one dataset before money is committed.
For multi-site employers, the job is simple to describe and hard to do well: the software needs to turn limited HRIS data, shift data, and postcode data into one comparable commute model across every site.
A good way to judge it is with three checks: one shared commute model, one simulation layer, and one reporting output.
Good software should turn HRIS postcodes, shift patterns, and working times into one model for each site and the full portfolio, without forcing you to survey every employee first.
Each site should use the same units so comparisons are clean:
That same model should power both scenario testing and reporting. If one site is measured one way and another site differently, you're comparing apples to oranges.
Once the commute model is in place, the simulation layer should let you test a new shuttle corridor, public transport incentives, a carpooling scheme, or a staggered start time before a single euro is spent.
The key comparisons are cost per boarded rider, load factor, commute-time impact, and emissions impact.
This matters because planning without simulation is a bit like booking buses first and asking questions later. For a multi-site employer, that's an easy way to waste budget. And if the software can't reuse the same commute model for reporting, it's not fit for a multi-site selection process.
Reporting should not sit apart from planning.
Scope 3 Category 7 reporting under CSRD, make audit-ability a must. A platform that records actual commute-distance data gives you a cleaner path to auditable reporting than survey-based estimates [1].
triply combines analysis, consolidation, simulation, and reporting in one workflow, so sustainability and operations teams work from the same commute data.
Not every demo feature should sway your shortlist. If your goal is pre-investment commute modelling across multiple sites, strip out anything that doesn't help with that job.
Real-time GPS tracking, driver turn-by-turn navigation, SOS alerts, and incident handling can all be useful. But they sit in day-to-day operations, not pre-investment planning.
The split is pretty simple: live tools run today's trips, while planning tools model next month's choices. If a feature gives you a real-time ETA or a driver manifest, it's operational. If it gives you a cost per boarded rider comparison or a Scope 3 Category 7 export, it helps with planning and reporting. For shortlist screening, that's the category you need.
Some platforms are built around vehicle-first logic. They optimise delivery windows, manage consignment routes, and track fuel cards. That makes sense for moving goods. It doesn't tell you much about moving people to work.
Employee commuting needs a different lens. You need home-location clustering, walking catchments, local rail and bus access, and shift-based demand patterns. A platform built for delivery windows won't say much about early shift starts, origin clusters, or public transport access that should sit inside a commute model.
The main entity is different too. A workforce transport platform tracks riders: eligibility, bookings, and boarding. Freight software tracks vehicles. For multi-site commute modelling, vehicle telematics should be treated as an input, not the heart of the product. That's why shortlist screening should stay fixed on commute modelling, not fleet optimisation.
Commuter perk catalogues, stipend administration, and pre-tax benefit workflows belong to a different software bucket. They may matter later, once you've picked the measures to run, but they won't help you choose those measures or test them across your sites.
At this stage, finance, operations, HR, and sustainability teams need a credible commute model plus a simulation layer they can use to back a multi-site mobility investment. What matters is whether the platform can build that model and run scenarios against it. The employee-facing layer can wait.
| Feature category | Useful for modelling and planning | Useful for day-to-day operations |
|---|---|---|
| Commute modelling and simulation | Yes | No |
| Scope 3 Category 7 reporting | Yes | No |
| Live GPS and ETA tracking | No | Yes |
| Driver turn-by-turn navigation | No | Yes |
| HRIS integration | Yes | Yes |
| Pre-tax benefit administration | No | Partially |
| Incident and SOS handling | No | Yes |
These exclusions keep your shortlist centred on modelling, simulation, and reporting. Use this filter in the next step when you score each demo against the same test case.
After you’ve removed dispatch, freight, and perks tools from the shortlist, evaluate every remaining platform the same way: same test case, same scoring sheet, same bar. That’s how you avoid shiny-demo syndrome and compare options on facts instead of sales polish.
Before you book even one demo, write down the basics that shape your commuter setup. That means your current mobility costs, your target cost per boarded rider, your load factor range, your Scope 3 Category 7 reporting needs, and site limits such as parking pressure, night or staggered shifts, security-gate clearance windows, and site-level safety rules, including separated boarding rules where needed. Add works council requirements that affect transport decisions and any local public transport gaps [1][2].
Use home postal codes from your HRIS instead of leaning on employee surveys. HRIS postal code data, paired with shift patterns and peak demand windows, gives you the base for one shared commute model [1].
Set KPIs before demos begin. A useful starting point is:
Those targets give you a steady benchmark when vendors start showing different workflows and claims.
Give each vendor the exact same test case. For example, ask them to model a hypothetical shuttle change for one plant and one shift pattern. They should use your real site locations and shift data, not a made-up sample [3].
Then score every demo in one shared sheet. Here’s a simple starting format:
| Requirement | Priority | Fit Score (illustrative 1–5) | Notes |
|---|---|---|---|
| Multi-site modelling from minimal data | High | ||
| Scope 3 Category 7 reporting | High | ||
| Scenario simulation before investment | High | ||
| HRIS/SSO integration (API-based) | High |
This keeps every conversation anchored to the same commute model. No moving goalposts. No side-by-side comparison based on different assumptions.
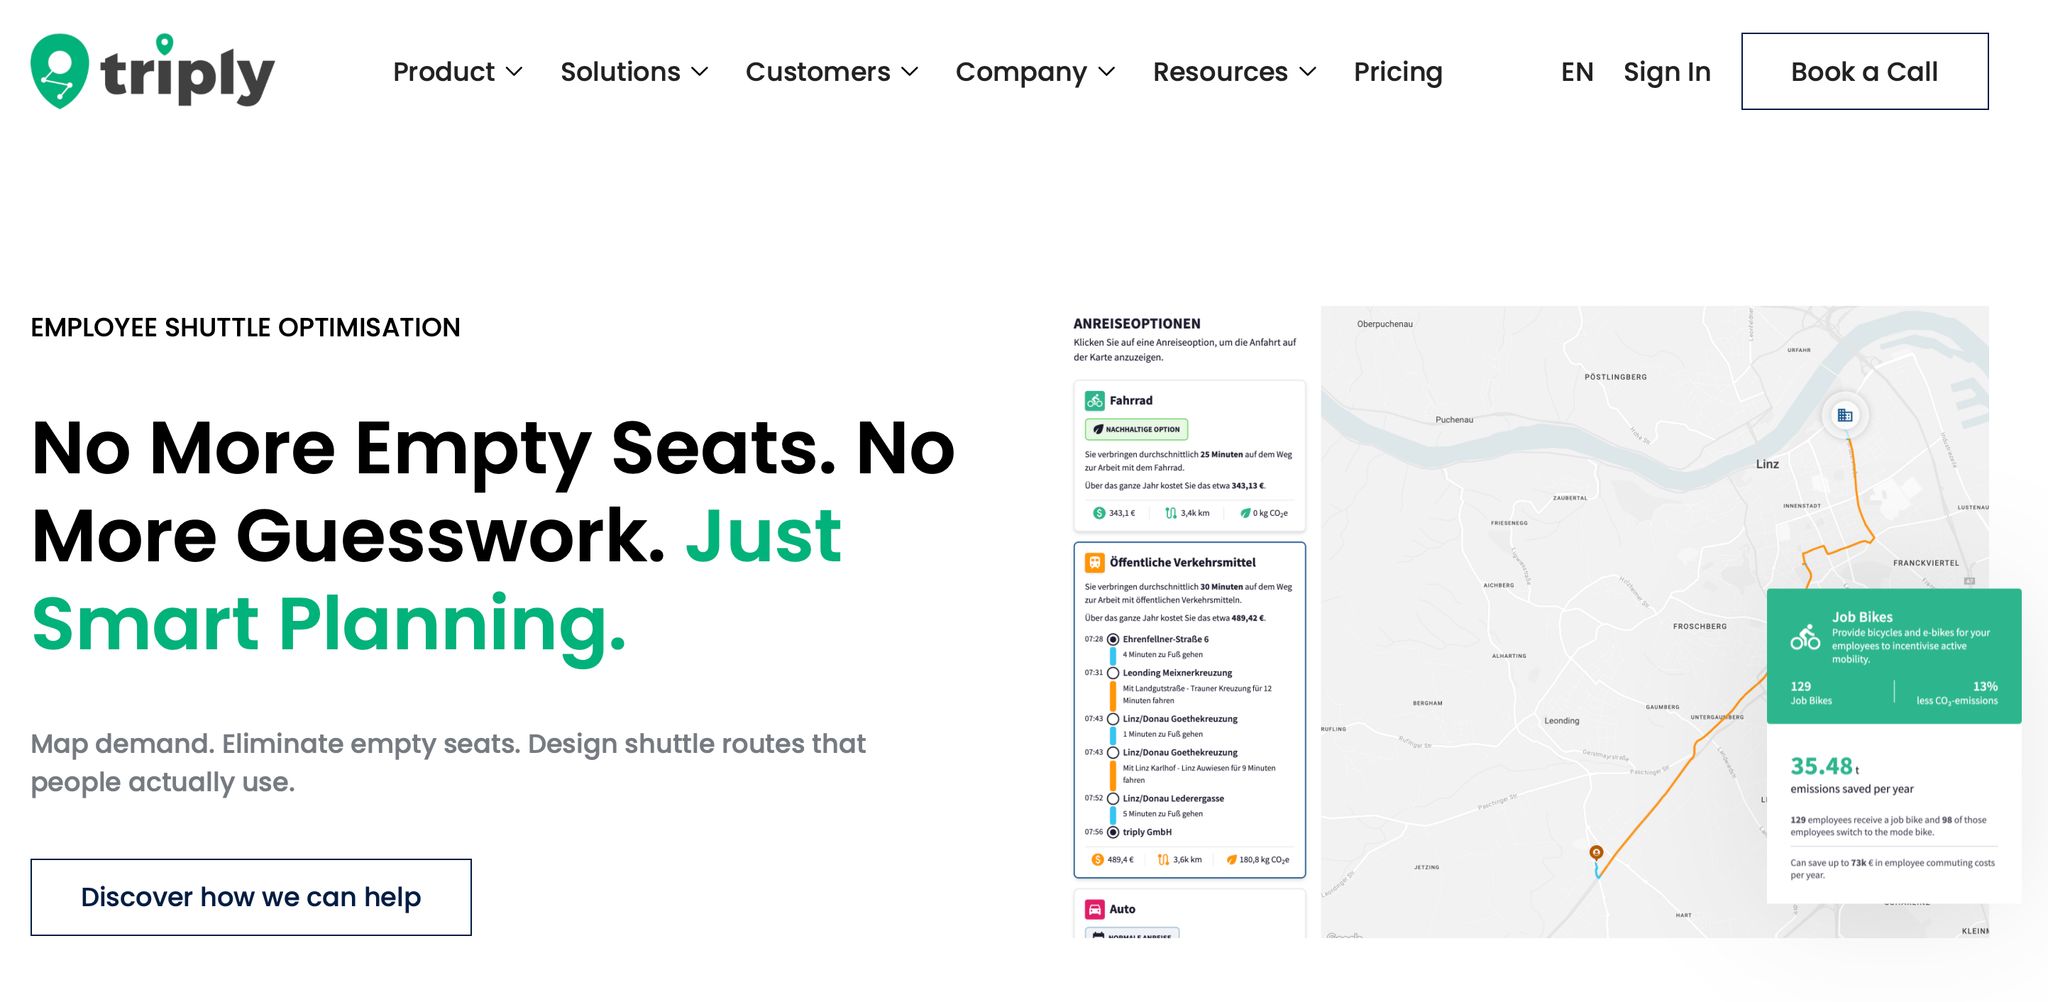
triply models commutes from postal codes and shift patterns, runs scenario simulations, and reports Scope 3 Category 7 from the same dataset.
In practice, that means you can look at multiple sites in one consolidated view, test a shuttle route or timetable change, and see the cost, load factor, and emissions effect before money is committed. That matters because transport planning often gets messy fast. One route tweak can look good on paper, then fall apart once shifts, rider density, and gate timing come into play.
triply’s Scope 3 Category 7 reporting uses a per-rider distance ledger instead of survey-based estimates. For sustainability teams working toward audit-ready outputs for CSRD or ESRS E1 reporting, that difference matters.
If your buying group includes finance, operations, HR, and sustainability leads, and they all need one shared dataset they can trust to support a multi-site mobility decision, that’s the use case triply is built for. This is general information, not legal or tax advice.
At the shortlist stage, the call usually comes down to three things: multi-site modelling, scenario simulation, and Scope 3 Category 7 reporting. These are the functions that tell you if a transport programme is likely to work before you spend a euro.
On that basis, triply fits the pre-investment use case. It models commutes using postal codes and shift patterns, simulates cost, load factor, and emissions impact, and produces audit-ready Scope 3 Category 7 outputs from the same dataset.
Ready to see how triply models your sites? Book a demo and use your real site locations and shift data.
This article provides general information only and does not constitute legal or tax advice.
To start, gather the core data your employee transportation management software needs: employee density clusters, shift patterns, attendance or badge-in data, HRIS data such as eligibility and cost-centre mapping, fleet composition, and a sample of historical trip records.
Historical trip records can include GPS logs and billing entries to create an audit baseline. This is general information, not legal or tax advice.
Use one data-led framework instead of anecdotal reviews. Set up a standardised scorecard for each site and corridor, and measure all of them with the same key performance indicators, such as cost per boarded rider, occupancy rates, ETA variance, and dead-kilometre ratios.
When data is collected the same way across sites, it becomes much easier to compare performance fairly, even when local conditions differ. This is general information, not legal or tax advice.
Using one dataset helps keep both operational planning and Scope 3 Category 7 reporting accurate and ready for audit. It links trip evidence, like who got in the vehicle and what the ride cost, to your reporting method.
That means less spreadsheet matching and one source of truth that finance, operations, and ESG teams can all use and defend. This is general information, not legal or tax advice.



