Test shuttle demand with minimal PLZ data, model routes, estimate load factor and cost per boarded rider, then decide.

Before you spend €1 on a shuttle, you should have four answers: Is there enough demand? Which routes can run on time? What load factor can we expect? And what will each boarded rider cost?
That is the whole point of a shuttle feasibility study. You use PLZ-level employee data, site locations, shift times in 24-hour format, and a few route scenarios to decide whether to proceed, redesign, or stop. The goal is simple: avoid paying for a shuttle that runs half-empty or misses the commute problem.
If we had to sum up the article in one short list, it would be this:
A few points stand out. The article treats a shuttle as just one commute measure, not the default answer. It also keeps the study lean: no full employee survey is needed at the start. And it pushes one rule that matters in budget meetings: if the shuttle only works in the high case, the risk is high too.
Here’s the quick view:
| What I need to test | What I look at |
|---|---|
| Demand | PLZ clusters, corridor density, shift windows |
| Route fit | Travel time, stop count, rail links, road limits |
| Use | Ridership range, seat fill rate |
| Cost | Vehicle, drivers, fuel or power, maintenance, insurance, admin |
| Decision | Proceed, redesign, or stop |
A shuttle, public transport support, carpooling, parking changes, and e-bike support should all be judged on the same employee base, same shifts, and same site conditions. Otherwise, the numbers do not mean much.
So, in plain terms: this article says you should test demand first, price the route second, and only then commit budget.
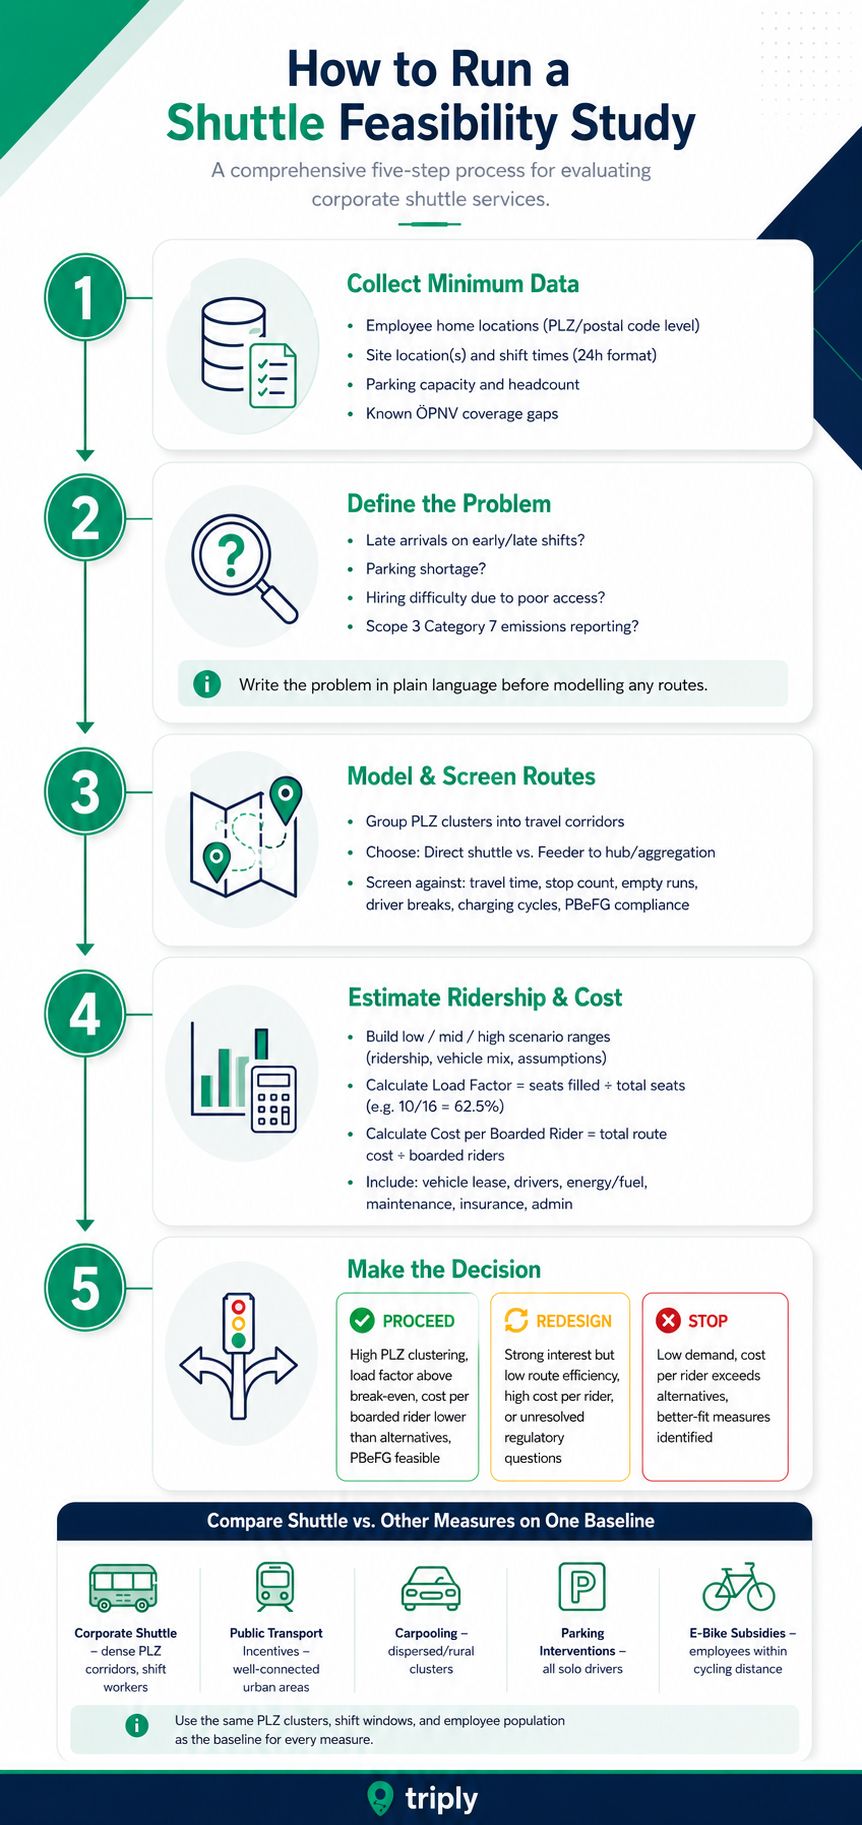
Once the decision question is clear, gather only the minimum data you need to check demand and route fit. A practical shuttle feasibility study doesn't need a full employee survey.
You need employee home locations at postal-code (PLZ) level, your site location(s), and shift start and end times in 24-hour format. Add parking capacity and headcount. Also note any known gaps in ÖPNV coverage near your site, both local and regional.
| Data category | What to collect | Why it matters |
|---|---|---|
| Employee data | Postal-code (PLZ), shift start and end times, remote-work days | Route clustering and capacity planning |
| Site data | Site location(s), parking spots | Identifying infrastructure constraints |
| Mobility data | Current commute modes, ÖPNV proximity | Spotting access gaps and likely mode-switch potential |
PLZ-level data is enough to group employees into corridors and estimate demand. Later, you can refine the inputs. But for an early check, this set is enough to see whether a route concept is worth pursuing at all.
Before you start modelling routes, write down the business problem in plain language. What's the actual issue?
Maybe employees arrive late on early or late shifts because connections are unreliable. Maybe parking is running short as headcount grows. Maybe hiring is harder because the site is difficult to reach without a car. Or maybe you need documented cuts in commute emissions for Scope 3 Category 7 reporting.
That level of specificity matters. It saves time later and keeps the study focused. If the main issue is weak ÖPNV coverage for early shifts, then model those time windows first instead of building a full-day timetable from scratch. In suburban and rural parts of Germany, ÖPNV trips can take much longer than driving, so those corridors are often the best place to begin.
A clear problem statement gives you a baseline. If you can't describe the gap before modelling, you won't know whether a route concept fixes it.
Next, use these inputs to group employees into corridors and test candidate routes.
This is general information, not legal or tax advice.
Turn the PLZ clusters and shift windows into a short list of route ideas you can test. Then score each one for ridership, load factor, and cost per boarded rider.
Start by mapping employee home PLZs and grouping them into natural travel corridors. A corridor is simply one direction of travel with enough nearby employees to justify a vehicle. Tie each cluster to the shift windows it serves and keep those two linked. A cluster can look strong on a map but still need a different timetable or vehicle size depending on the shift.
Next, decide whether each corridor is better served by a direct shuttle or a feeder route. A direct shuttle makes sense when employee density along the corridor is high enough to fill a vehicle without adding too many stops. A feeder route to the nearest S-Bahn, U-Bahn, or Regionalbahn station is often the better fit when employees are spread across a larger area and can make their own way to a rail hub [1][3].
Put simply, direct routes cut transfers but need more concentrated demand. Feeder models work better when homes are more scattered because they build on the rail network that already exists [1][3]. That gives you a small set of route concepts worth testing.
Before you spend more time on any concept, run a practical screen. This is a pre-investment check, not a full operating plan. Keep it simple and test each route against a few hard limits:
Keep only the concepts that make sense on the map, match the shift pattern, and pass this screen. Those are the ones you take into ridership and cost modelling.
Once you’ve screened your route concepts, the next step is simple: put numbers behind them. These are the figures that help you make a solid budget call.
Start with the catchment size for each route. In plain terms, how many employees live within a reasonable distance of the corridor, and how many of them work during the shift windows that route would cover?
From there, apply adoption assumptions and build scenario ranges instead of relying on one fixed number. Mark each scenario as illustrative, because actual take-up will depend on site-specific factors you haven’t measured yet. Use the same PLZ clusters and shift windows from the route screen so each scenario stays linked to the demand map you already built.
A wide range usually points to higher demand risk. If a route only makes financial sense in the optimistic case, that route carries more risk. If it still works in the conservative case, the concept is more stable.
Load factor is the share of seats filled on a trip. For example, if a 16-seat minibus carries 10 passengers, the load factor is 62.5%.
A low load factor usually means one of three things:
And when that happens, the cost per boarded rider goes up. That figure is the route’s total operating cost divided by boarded riders over the same period.
Taken together, these two numbers tell you a lot. They show whether a route is viable, oversized, or simply running at the wrong times. If load factor stays low across all scenarios, the route likely needs a smaller vehicle, fewer stops, or a different timetable.
To calculate cost per boarded rider, include the cost items that shape the budget [1][2][4].
| Cost category | What to include |
|---|---|
| Vehicle acquisition or leasing | Purchase price or monthly lease rate per vehicle |
| Personnel | Driver and dispatcher costs |
| Energy or fuel | Diesel or electricity costs, including charging infrastructure for electric minibuses |
| Maintenance and repair | Scheduled servicing and wear-and-tear |
| Insurance | Commercial passenger transport insurance |
| Overheads and administration | IT systems, technical control centres, system security, and administrative overheads |
Run this cost model across each scenario range. That gives you a cost-per-boarded-rider range for every route concept. Use those route-level ranges as the baseline for the next step, where you compare shuttle scenarios with other commute measures on one common basis.
This is general information, not legal or tax advice.
A shuttle is just one way to close a commute gap. Before you sign off on budget, it helps to test it against other options on the same baseline: the same PLZ clusters, the same shift windows, and the same employee population.
That matters more than it sounds. If each measure is judged on a different demand map, the comparison falls apart. You want to know which option gives you the best mix of cost per boarded rider, Scope 3 Category 7 impact, and day-to-day service quality, including travel time and ease of access.
Use one baseline so every option is judged against the same commute pattern.
Which measures make sense depends on your site. A shuttle usually works best when employees live in dense residential corridors and public transport doesn’t line up well with shift times. In well-connected urban areas, public transport incentives can be a practical fit. In more dispersed residential areas, carpooling often makes more sense, even though uptake is often lower. Urban sites also tend to have more car-free employees than rural sites, which shifts the best-fit option.
| Measure | Target employee group | Cost logic | Constraints | Scope 3 Category 7 implications |
|---|---|---|---|---|
| Corporate shuttle | High-density PLZ clusters, shift workers | Fixed lease and operating costs; cost-sharing with neighbouring companies in industrial parks can improve efficiency [1] | Requires minimum load factor to be viable | Direct reduction of passenger-km in private cars |
| Public transport incentives | Employees in well-connected urban areas | Per-user subsidy | Limited to areas with existing network quality | Significant reduction; relies on existing network |
| Carpooling | Dispersed residential areas, rural clusters | Platform fees and small incentives | Requires critical mass to find matches | Moderate; improves load factor |
| Parking interventions | All current solo drivers | Low administration and signage costs | May face high employee resistance | Indirect; discourages solo driving |
| E-bike subsidies | Employees within cycling distance of the site | One-time or monthly subsidy | Weather and local infrastructure dependent | Eliminates short-distance car emissions |
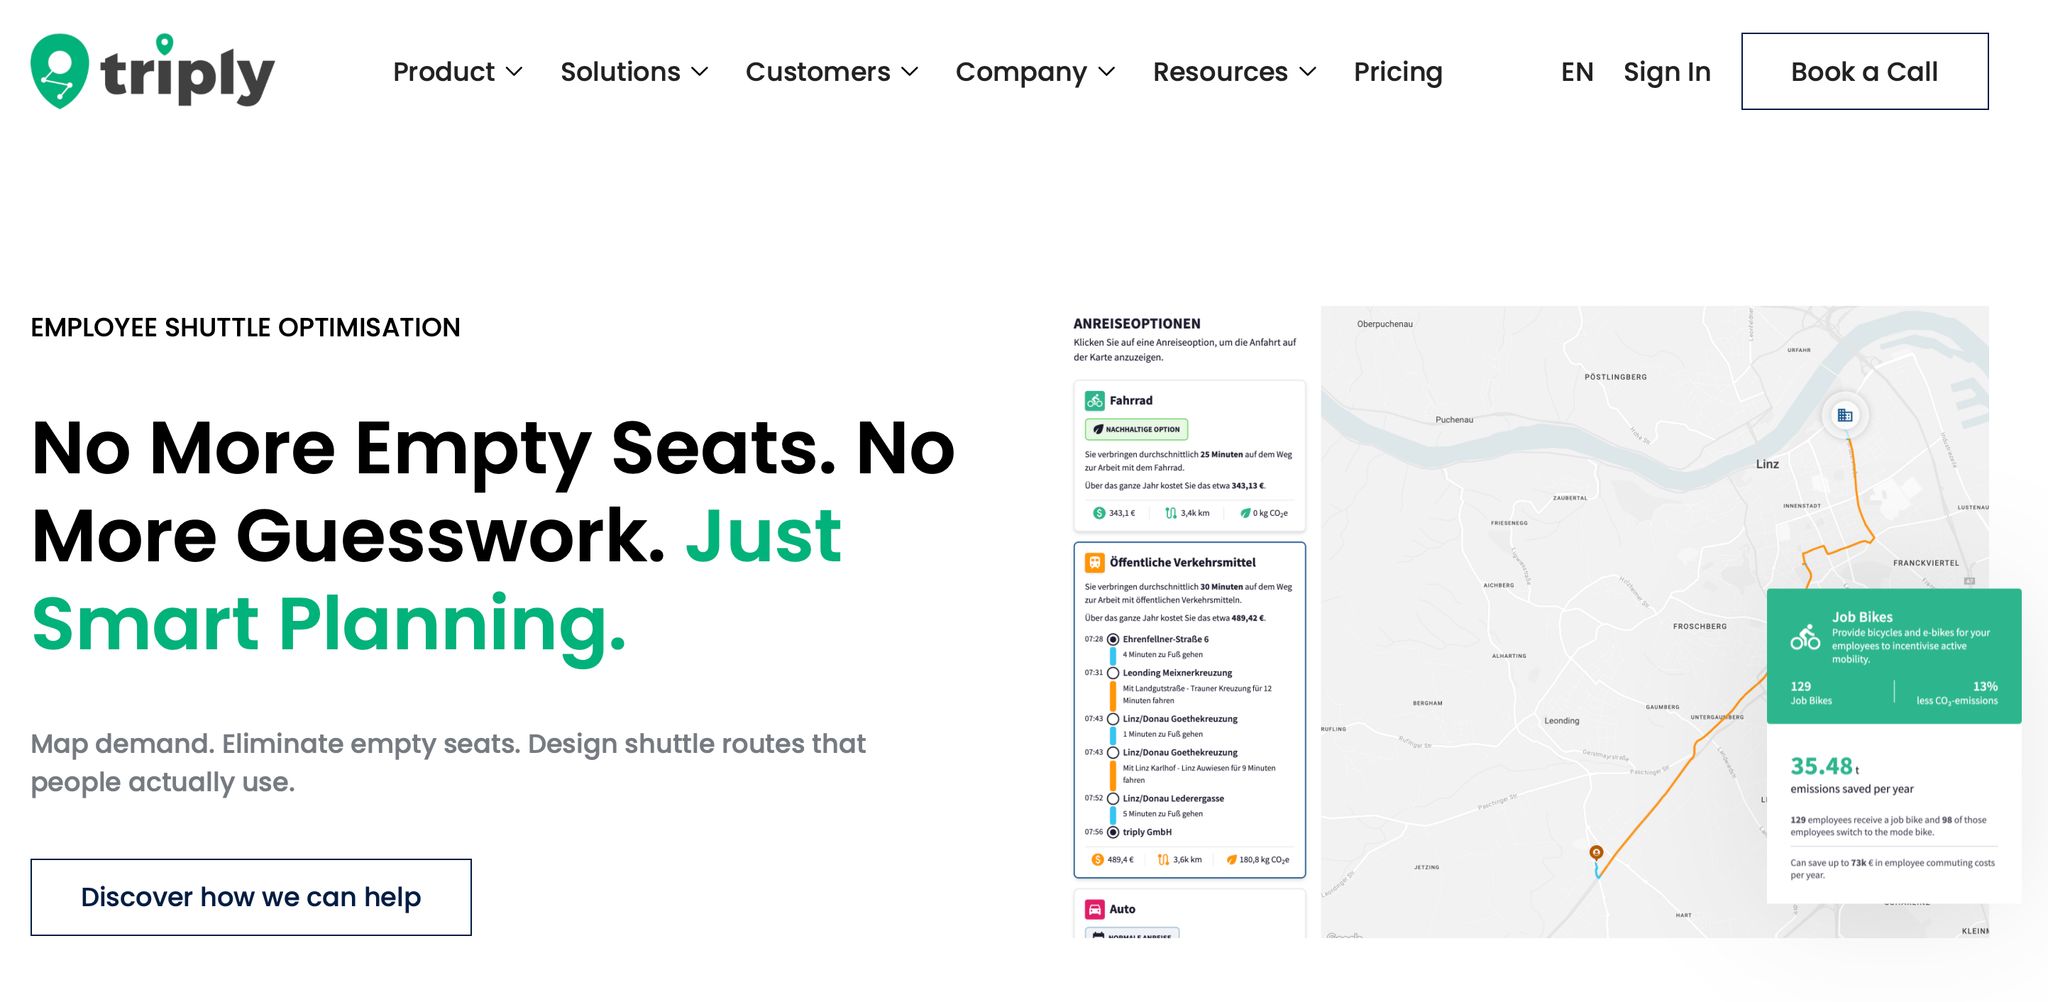
triply lets you test these measures on one shared commute baseline before any money is committed.
Its Analyse capability builds a commute model for each site from minimal data, such as postal codes and shift patterns, without needing a full employee survey. Consolidate then brings multiple sites into one consistent view, so you’re not comparing unlike locations across your network.
The side-by-side test happens in Simulate. You can model a shuttle scenario, a public transport subsidy rollout, a carpooling scheme, and a schedule change using the same underlying commute model. Each simulation shows projected uptake, cost, and Scope 3 Category 7 emissions impact before budget approval.
After that, Report produces audit-ready Scope 3 Category 7 output for CSRD and ESRS E1 purposes.
Put simply, triply is the pre-investment commute modelling layer for sizing and comparing measures before budget approval. It gives finance, sustainability, and operations teams one shared data set they can use before a budget decision is made.
This is general information, not legal or tax advice.
Once the model results are in, you need to make one call: proceed, redesign, or stop. That call should come from a short but complete output, not a vague summary.
A feasibility study output should be brief and complete. At a minimum, it should include an executive summary with a clear recommendation, the demand corridors and PLZ clusters driving the case, the candidate routes and timetables tested, ridership scenarios with low and high estimates, load factor and cost per boarded rider for each route, Scope 3 Category 7 impact and service quality, and PBefG compliance.
It should also spell out what is still uncertain. Saying where data is missing helps keep the report honest and stops teams from sounding more sure than they should at an early stage.
Map the main signals to one of three outcomes:
| Decision outcome | Signals | Next step |
|---|---|---|
| Proceed | High PLZ clustering, load factor above break-even, cost per boarded rider lower than current alternatives, PBefG compliance feasible | Commit budget and begin procurement or tender |
| Redesign | Strong employee interest but low route efficiency, high cost per boarded rider, or unresolved regulatory questions | Adjust routes, shift windows, or seek cost-sharing partners |
| Stop | Low demand, cost per boarded rider significantly exceeds alternatives, better-fit measures identified, or legal hurdles cannot be resolved | Redirect budget to the measure that scored better on the same baseline |
If the study points to redesign, treat that as a valid result, not a failure. In many cases, partnerships can improve load factor and help spread fixed costs.
If the model is still uncertain, stick with the same baseline in triply and test one more scenario before you commit budget. That extra analysis usually costs far less than launching the wrong route. Start with minimal commute data, model only the routes that make sense for your PLZ clusters and shift windows, estimate ridership with scenario ranges instead of single-point forecasts, and compare the shuttle with other measures on one shared baseline.
If you want to see how triply can help you test your own site data, book a demo to test your shuttle feasibility study before you approve budget.
This is general information, not legal or tax advice.
A shuttle feasibility study usually takes a few days to one week.
In most cases, an internal analysis needs two to four days of work. If you bring in a specialist, the assessment can often be finished in less than one week.
That’s often enough time to collect the data you need and avoid costly planning mistakes.
Please note that this is general information, not legal or tax advice.
PLZ-level data is usually enough in the initial scoping phase of a shuttle feasibility study. It gives you a solid first look at residential density and broad geographic patterns, which helps you spot likely demand corridors and sketch candidate routes at a high level.
Once you’ve confirmed that the idea makes sense in general, move to more granular commute-time data and exact stop locations to finalise operational planning. This is general information, not legal or tax advice.
If your shuttle feasibility study points to borderline demand, don't rush into a fixed-route service. First, work on two things: getting more seats filled and cutting operating costs. That's often where the decision swings.
Use commute data to tighten your route plan. Look at where people are actually travelling from, when they travel, and which stops would serve the biggest share of demand. Then put coverage first in the areas where demand is strongest instead of spreading the service too thin.
You can also test lower-cost, more flexible options before committing to a full shuttle rollout, such as:
Then weigh the costs against the expected gains and decide whether a pilot or a smaller service makes sense.
(This is general information, not legal or tax advice.)
A shuttle capability study evaluates the demand for a shuttle service, route planning, and cost per passenger to make informed budget decisions.
A shuttle capability study typically takes a few days to a week, with an internal analysis taking two to four days.
For a shuttle capability study, you will need employee zip code data, locations, shift times, and information on current shuttle patterns to evaluate demand and routes.
The profitability of a shuttle is assessed by the ratio of filled seats to operating costs, including the estimate of the number of passengers and the cost per passenger.
In the initial phase of a shuttle capability study, zip code data is sufficient to determine the residential density and probable demand routes.