Test shuttle costs against parking, retention, attendance and Scope 3 emissions to see if a corporate shuttle truly pays.

Before you launch an employee shuttle, you need one simple answer: will it save more than it costs?
The fastest way to test that is to model cost, parking impact, staff retention, attendance, and commute time before signing anything.
In plain terms, the case will be built like this:
That is the core idea. If load factor is weak, the case weakens fast. If rider uptake and parking substitution are strong, the numbers can work.
A few points matter most from the start:
Here is a short view of the model logic:
| Area | What you should check | Why it matters |
|---|---|---|
| Scope | Sites, shifts, corridors | Sets route density and service size |
| Baseline | Commute data, parking, emissions | Shows today’s cost and pain points |
| Shuttle cost | Fixed cost + cost per vehicle hour | Shows annual spend |
| Rider maths | Uptake + load factor | Drives cost per boarded rider |
| Value | Parking, attendance, retention, emissions | Shows what the shuttle may offset |
| Scenarios | Low, base, high case | Shows whether the case still works under pressure |
The short version: Shuttle ROI should not be treated as a transport-only exercise. HR, facilities, and finance data, should be tied together; Then test whether the shuttle still pays off under a low-uptake case. That is what makes the launch decision easier to review.
Using the site or site-cluster scope you just set, create one shared baseline. Then turn that baseline into a shared model.
Start with HRIS postal-code data. Pull employee home postal codes (PLZ) straight from the system instead of leaning on self-reported survey addresses. Survey data gets old fast, and that can skew the numbers. Then match those home locations with shift schedules to spot corridors where demand is dense enough to support a fixed route [3][4].
From there, gather these inputs:
These inputs feed both your cost model and your Scope 3 Category 7 employee commuting calculation. That, in turn, supports Scope 3 reporting for many large employers under the EU CSRD [3].
Parking often gets missed or understated at this stage. Treat structured parking as a recurring cost, not just a one-off asset, because it comes with ongoing operations and maintenance expense [1].
Once you have the raw data, pull it into one table that covers no-shuttle cost, time, and emissions. This is the sign-off table for finance, HR, operations, and sustainability. Keep it in one place. Don’t split it across separate HR, facilities, and sustainability files. Every figure should trace back to a source, or be clearly marked as an illustrative estimate.
| Baseline category | Data to capture | Why it matters for ROI |
|---|---|---|
| Parking infrastructure | Stall count, peak utilisation, annual maintenance and security cost | Identifies avoided capex and recurring spend |
| Transport support spend | Current subsidies and commuter benefit payments | Sets the direct cost baseline |
| Average commute time | One-way commute time by mode | Links to absenteeism and turnover risk |
| Commute-related attrition | Share of voluntary exits citing commute friction | Quantifies retention cost exposure |
| Annual commuting emissions | Total employee-commuting emissions | Required for Scope 3 Category 7 reporting [3] |
triply can build this baseline from postal codes and shift data alone, without a full employee survey.
With the baseline fixed, you can now price the shuttle against it.
General information only, not legal or tax advice.
Once your baseline table is set, you can price the shuttle itself. The goal is simple: turn corridor demand into service hours, seat supply, and cost. To do that well, split costs into two buckets: what you pay no matter how many people ride, and what goes up as service volume grows.
Fixed costs do not change with ridership. These usually include vehicle purchase or lease amortisation, stop infrastructure, depot or parking upgrades, tech licences, insurance, permits, and admin overhead [5][1].
Variable costs change with the amount of service you run. Driver labour is often the biggest item, based on scheduled vehicle hours multiplied by the all-in hourly driver rate. You should also include fuel or energy use, maintenance and repairs, cleaning, tyres, and utilities [5][1].
At this stage, operator quotes are the best source for final pricing. If you use market ranges early on, label them as illustrative. That matters. Early numbers help you test the case, but they are not the same as contracted rates. For smaller sites, a contracted shuttle can also lower exit risk if ridership lands below target, compared with buying a fleet outright [1].
Three formulas run the model [2][3]:
| Metric | Formula |
|---|---|
| Annual shuttle cost | Total fixed costs + (cost per scheduled vehicle hour × total annual scheduled vehicle hours) |
| Load factor | Total boarded riders / total seats supplied |
| Cost per boarded rider | Total annual shuttle cost ÷ total annual boarded riders |
Load factor is the number that can swing your cost per boarded rider the most before launch [3]. That’s why it deserves close attention. A route can look fine on paper at mid-level occupancy, then get hard to defend if actual ridership settles at the low end. In many cases, smaller vehicles help lift load factor when corridor demand is limited, without forcing you to change the route itself.
Here’s how that usually plays out across three sample cases [2][3]:
| Occupancy level | Load factor | Estimated cost per boarded rider | What it signals |
|---|---|---|---|
| Low | Below 45% | High cost per boarded rider | Route redesign or smaller vehicles needed |
| Medium | 60% to 80% | Best balance of cost and rider experience | |
| High | Above 90% | Strong efficiency, but risk of rider bumping |
These outputs feed the cost side of the ROI model you’ll compare against parking, productivity, retention, and emissions savings.
One last point: size the fleet from eligible employees only, based on home PLZ and shift fit. That group drives boarded riders, which then drives load factor and cost per boarded rider.
Use the same ridership forecast and corridor split from your cost model. Then split the upside into two buckets: hard savings and soft benefits. After that, model each one on its own terms.
Start with a drive-alone displacement rate tied to your ridership forecast. If 60% of shuttle riders used to drive alone, every 100 boarded riders removes about 60 parking spaces from your site each day [1][2].
That has a direct cost angle. Those are spaces you may no longer need to build, maintain, or keep reserved.
The rule here is simple:
Treat productivity more carefully. In most cases, it belongs in the soft benefit bucket unless you can clearly show that time saved on the commute turns into usable work time.
For retention, start with exit interviews and attrition by cohort. If a measurable share of voluntary leavers point to commute difficulty, model avoided replacement cost. That cost often lands between 50% and 200% of annual salary, depending on seniority [3].
You can make this case stronger by comparing voluntary attrition between shuttle-eligible and non-eligible cohorts at the same site. That kind of side-by-side view gives finance and HR something solid to work with.
For attendance, use your own attendance logs and shift coverage costs. No guesswork needed if the data already sits in your systems.
For Scope 3 Category 7, build it into the same pre-launch model. Multiply avoided commuter kilometres by an emission factor for the commuting mode being replaced. Then subtract shuttle emissions.
A per-rider distance ledger is better than a one-time estimate. It gives you cleaner, more audit-ready data, which matters if your organisation falls under CSRD disclosure requirements [3].
Bring the outputs from your baseline and cost model into one decision table. That way, finance can separate hard, soft, and strategic value without mixing them up. Each row should come from the same dataset, just translated into a different benefit line.
| Benefit category | Metric definition | Calculation logic | Required input | Benefit type |
|---|---|---|---|---|
| Parking | Avoided capex or opex | (Spaces avoided × construction cost) + (spaces × annual O&M) | Construction quotes, O&M budget, displacement rate | Hard |
| Productivity | Recovered commute time | Commute hours recovered per rider × fully loaded hourly rate | Average commute time, rider salary data | Soft |
| Retention | Avoided turnover cost | Commute-related quits reduced × replacement cost (50% to 200% of salary) [3] | Exit interviews, HRIS attrition by cohort | Soft / Strategic |
| Attendance | Reduced absenteeism | Avoided absent days × average cost of absence | Attendance logs, shift coverage cost | Soft |
| Emissions | Scope 3 Category 7 reduction | (Avoided commuter-km × emission factor) less shuttle emissions | Rider-kilometres, vehicle type | Strategic / Compliance |
Keep these categories separate at this stage. Once that’s done, you can carry them into ROI and sensitivity cases with a cleaner, more defensible model.
Employee Shuttle ROI: Conservative vs Base vs Optimistic Scenarios
Once you’ve split the benefits into clear categories, employee shuttle ROI becomes pretty direct: net benefit = annual benefit - annual shuttle cost. If your finance team works with NPV, run the same cases over three years against your hurdle rate [2][3]. The maths is the easy part. The harder part, and the part that makes the model stand up in review, is the discipline you apply before launch.
ROI is most sensitive to ridership uptake, load factor, and turnover reduction, meaning the share of commute-attributable quits you prevent [2][3]. Survey responses can paint a nicer picture than day-to-day behaviour, so the conservative case should assume slower adoption than early feedback suggests [3].
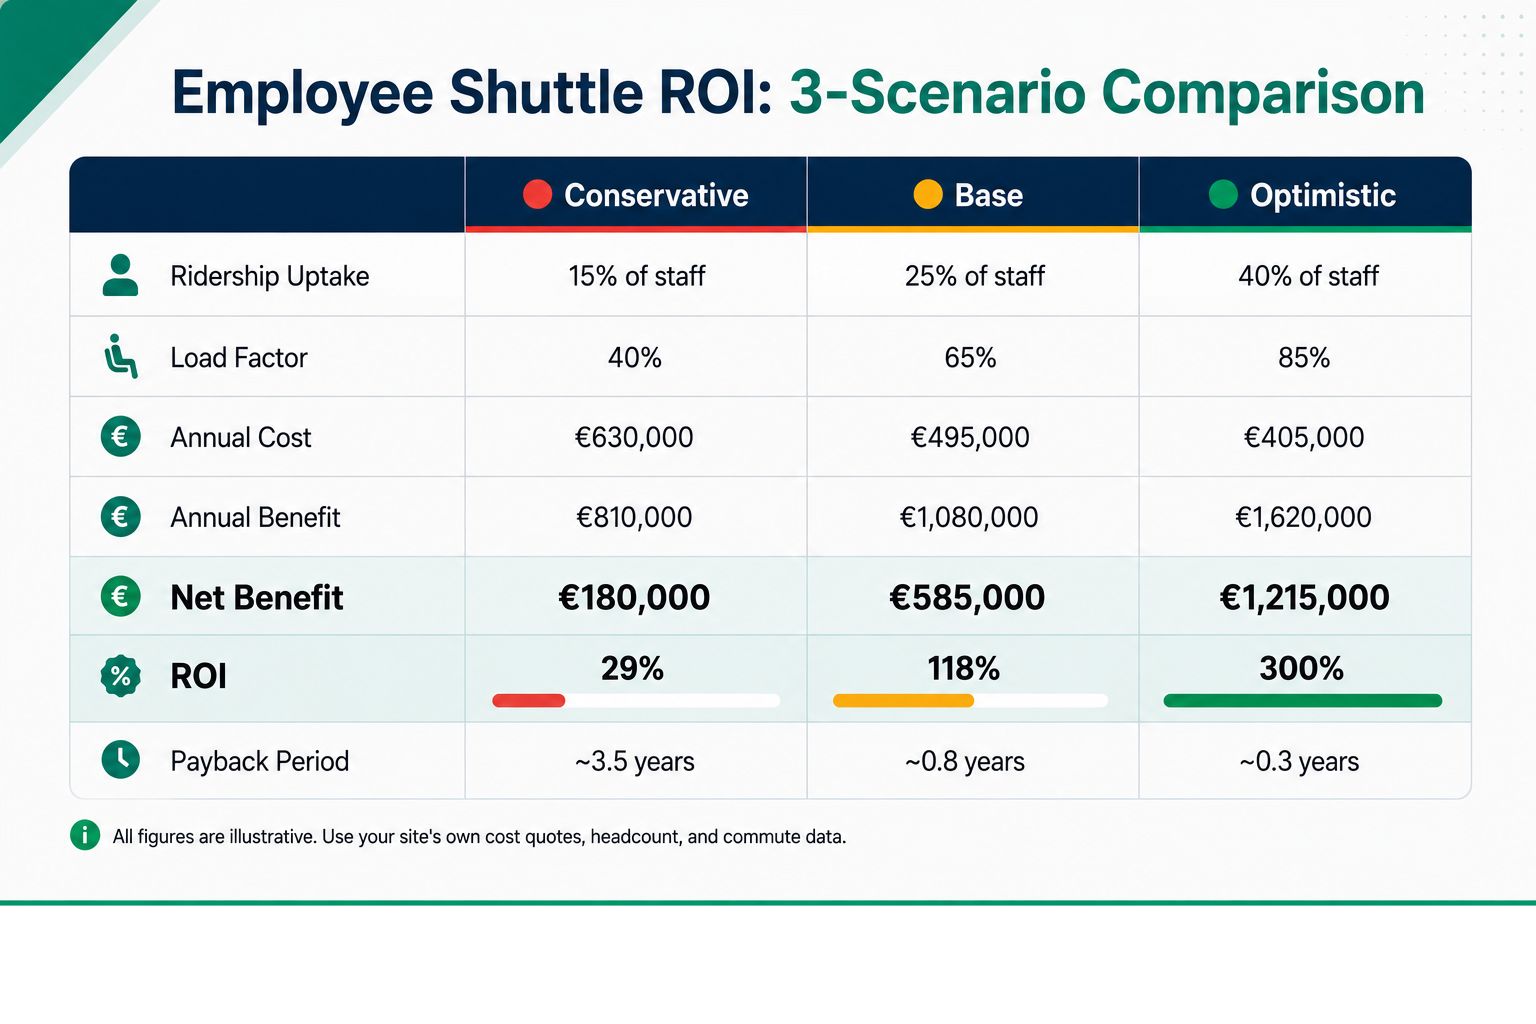
The table below shows sample outcomes for one representative site.
| Scenario | Ridership uptake | Load factor | Annual cost | Annual benefit | Net benefit | ROI | Payback period |
|---|---|---|---|---|---|---|---|
| Conservative | 15% of staff | 40% | €630,000 | €810,000 | €180,000 | 29% | ~3.5 years |
| Base | 25% of staff | 65% | €495,000 | €1,080,000 | €585,000 | 118% | ~0.8 years |
| Optimistic | 40% of staff | 85% | €405,000 | €1,620,000 | €1,215,000 | 300% | ~0.3 years |
All figures are illustrative only. Use your site’s own cost quotes, headcount, and commute data for the actual model.
Before you take this to finance and procurement, set a pre-agreed stop rule. For example, re-scope the programme if Year 1 adoption comes in below 20% of headcount [2]. That kind of guardrail shows rigour, not doubt.
The example below shows how the same model can look at one large German site.
Consider a manufacturing site in Germany with 1.200 employees, two main shift patterns, and a parking facility nearing its maintenance cycle. All figures below are illustrative.
Use the same inputs here: parking, turnover, attendance, and Scope 3 Category 7. In the baseline, include parking operations, commute-driven turnover, commute-linked absenteeism, and Scope 3 Category 7 exposure. In this example, parking operations are €420,000 per year. Turnover is modelled as a 15% to 20% commute-attributable share of voluntary turnover, with replacement costs at 50% to 200% of annual salary [2][3].
In a base case, the site runs two fixed routes across the highest-density commute corridors and aims for a 65% load factor. Sample annual shuttle cost comes in at around €500,000. Sample annual benefit, made up of avoided parking maintenance, lower commute-attributable attrition, and lower Scope 3 Category 7 emissions, reaches about €1,100,000. That leaves a net benefit of roughly €600,000 and a payback period of less than one year.
Larger sites can spread fixed shuttle costs more easily. Smaller sites usually need denser demand and higher occupancy.
A defensible model needs a documented baseline, a full cost build, clearly separated benefit categories, and scenario testing that still holds up under conservative assumptions. Miss one of those pieces, and a sceptical CFO or procurement lead will spot the gap fast.
triply's pre-investment commute modelling and measure simulation lets you build this model before you commit to a route or a contract. You can test ridership uptake, load factor, and parking substitution against your actual commute data, then produce audit-ready Scope 3 Category 7 outputs in the same workflow. To see how the model works for your site, explore triply's employee shuttle optimisation approach and book a demo with triply.
This is general information only and does not constitute legal or tax advice. Consult qualified advisers for guidance specific to your organisation and jurisdiction.
You need enough data to put a number on your current parking spend, staff size, and commuting habits. In plain terms, that means your current parking space count, the capital and upkeep costs tied to those spaces, total headcount, average salary, and current staff turnover.
You’ll also want a clear view of the local labour market and typical running costs for commercial coach or public transport services. When you combine that with your site-specific commute flows, you can build an ROI model that stands up to scrutiny.
This is general information, not legal or tax advice.
If shuttle uptake comes in below plan, your ROI model can still hold up. The key is a service contract that lets you scale routes or vehicle sizes up or down based on actual usage.
You can cut risk by starting with a pilot phase. From there, you can improve load factor and lower cost per boarded rider through route optimisation and stop consolidation.
This is general information, not legal or tax advice.
Hard savings are direct, measurable cuts in operating costs or avoided capital spend. That can include lower parking lease payments, reduced land acquisition costs, and avoided parking construction or maintenance costs.
Soft benefits are indirect gains that may turn into financial value over time. Think higher productivity, lower absenteeism, better retention, and a stronger employer brand.
This is general information, not legal or tax advice.
To model the ROI of an employee shuttle, you need to consider the cost of the shuttle, the parking impact, employee retention, attendance and commuting time. Create a comparative analysis of current costs against possible savings.
You need data on current parking costs, the number of employees and commuting habits. These include the number of parking spaces, the cost of their maintenance and current cancellation rates.
The capacity utilisation has a significant impact on the cost per passenger transported. Low capacity utilisation can significantly increase costs and jeopardise the profitability of the shuttle.
Hard savings are direct, measurable cost reductions, such as lower parking costs. Soft benefits include aspects such as higher productivity and improved employee retention.
An employee shuttle can reduce emissions by reducing the number of commuters travelling by car. This is particularly important for the reporting of Scope 3 emissions.