
Commute gaps at Mexican plants drive absenteeism and early exits; map stop access, travel time, and load factor before changing routes.

If workers cannot get to the plant on time, attrition can start before the shift starts. In many Mexican plants, transport issues show up first as missed pickups, long travel times, unsafe waiting points, and routes that do not match shift hours.
Here is the short version:
A few sample checks make the issue easier to see:
What this means for you is simple: before you add a bus, change a route, or approve more budget, first map where workers live, compare that with shift patterns, and check where access breaks down. That gives you a clearer view of where cost, attendance, and emissions issues come from.
Quick comparison
| What to check | What it shows | Why it matters |
|---|---|---|
| Stop access | Whether workers can reach pickup points | Long walks can lead to lateness and drop-off |
| Travel time | Whether the full commute is workable | Long trips wear people down |
| Load factor | Whether vehicles are overfilled or underused | Poor route fit wastes spend |
| Cost per boarded rider | What each rider costs on a route | Helps compare route value |
| Absenteeism | Where transport trouble hits attendance | Often the first HR signal |
| Early-tenure exits | Where new hires leave fast | Can point to commute strain |
| Scope 3 Category 7 | Emissions from employee commuting | Lets you track commuting impact in the same model |
So the core point is clear: the bus stop is often the first place to look when attrition starts to climb.
When transport stops being dependable, the first hit usually isn’t fuel spend or fleet size. It’s missed shifts and workers checking out.
If a worker misses a pickup, they miss the shift. If that keeps happening, the strain starts to stack up. What looks like a simple scheduling mismatch can turn into a pattern of absence. And for people in their first few weeks on the job, that pattern often ends in an early exit.
Fixed routes and shift-based pickups start to fail when worker locations, pickup points, or shift times no longer line up with demand.
A route built for one shift pattern can leave clear gaps once a second shift is added. The same thing happens when the workforce starts spreading into a new residential area. Stops that made sense at launch may now be too far from where workers live today. That gap between the original setup and current conditions is where commute failure starts to build, often without much noise at first.
That’s why route design, stop placement, and shift timing need to be looked at together.
HR feels it through higher absence rates and more early-tenure exits. Operations feels it through weaker headcount coverage and unplanned downtime when shifts start short. Finance feels it through transport spend that still doesn’t turn into dependable attendance, with some vehicles running underloaded while demand is missed elsewhere.
Different teams may see different symptoms. But they’re dealing with the same root issue.
Before changing routes or putting more money into transport, measure where commute risk is building first.
Don’t add routes or spend more money before you model the gap. A small set of focused metrics can tell you if your current setup lines up with where your workers live, when they work, and what it costs to move them.
Start with the bus stop: who can get there, and who can get to the plant on time? Set thresholds that fit your site, such as 800 metres to a stop or 60 minutes for end-to-end travel time. Those are sample thresholds, not fixed rules. The point is to map the gaps instead of assuming coverage is even across the workforce.
Break the data down by shift. If you only look at the full workforce, one shift can hide the actual access problem. Once you can see the access gaps, you can test whether the routes themselves still make sense.
Read load factor and cost per boarded rider together. A route with a low load factor is adding cost without moving enough people. A route with a high load factor but weak geographic coverage may be serving a corridor that no longer matches where your workers live.
Taken together, these metrics show which routes are doing useful work and which ones are soaking up budget without helping attendance or retention. From there, connect route efficiency to attendance data and early exits.

Link transport data to absenteeism, early-tenure exits, and Scope 3 Category 7. When you map absenteeism patterns and early-tenure exit rates against stop access and end-to-end travel time, you can see where transport quality is adding attendance and retention risk.
Scope 3 Category 7 covers employee commuting emissions, and it should sit in the same model, not in a separate reporting exercise. If you know commute distances across your workforce, you can estimate your Category 7 footprint from the same data you already use to assess coverage and cost. That gives you one view across transport, attendance, retention, and emissions.
This is general information, not legal advice.
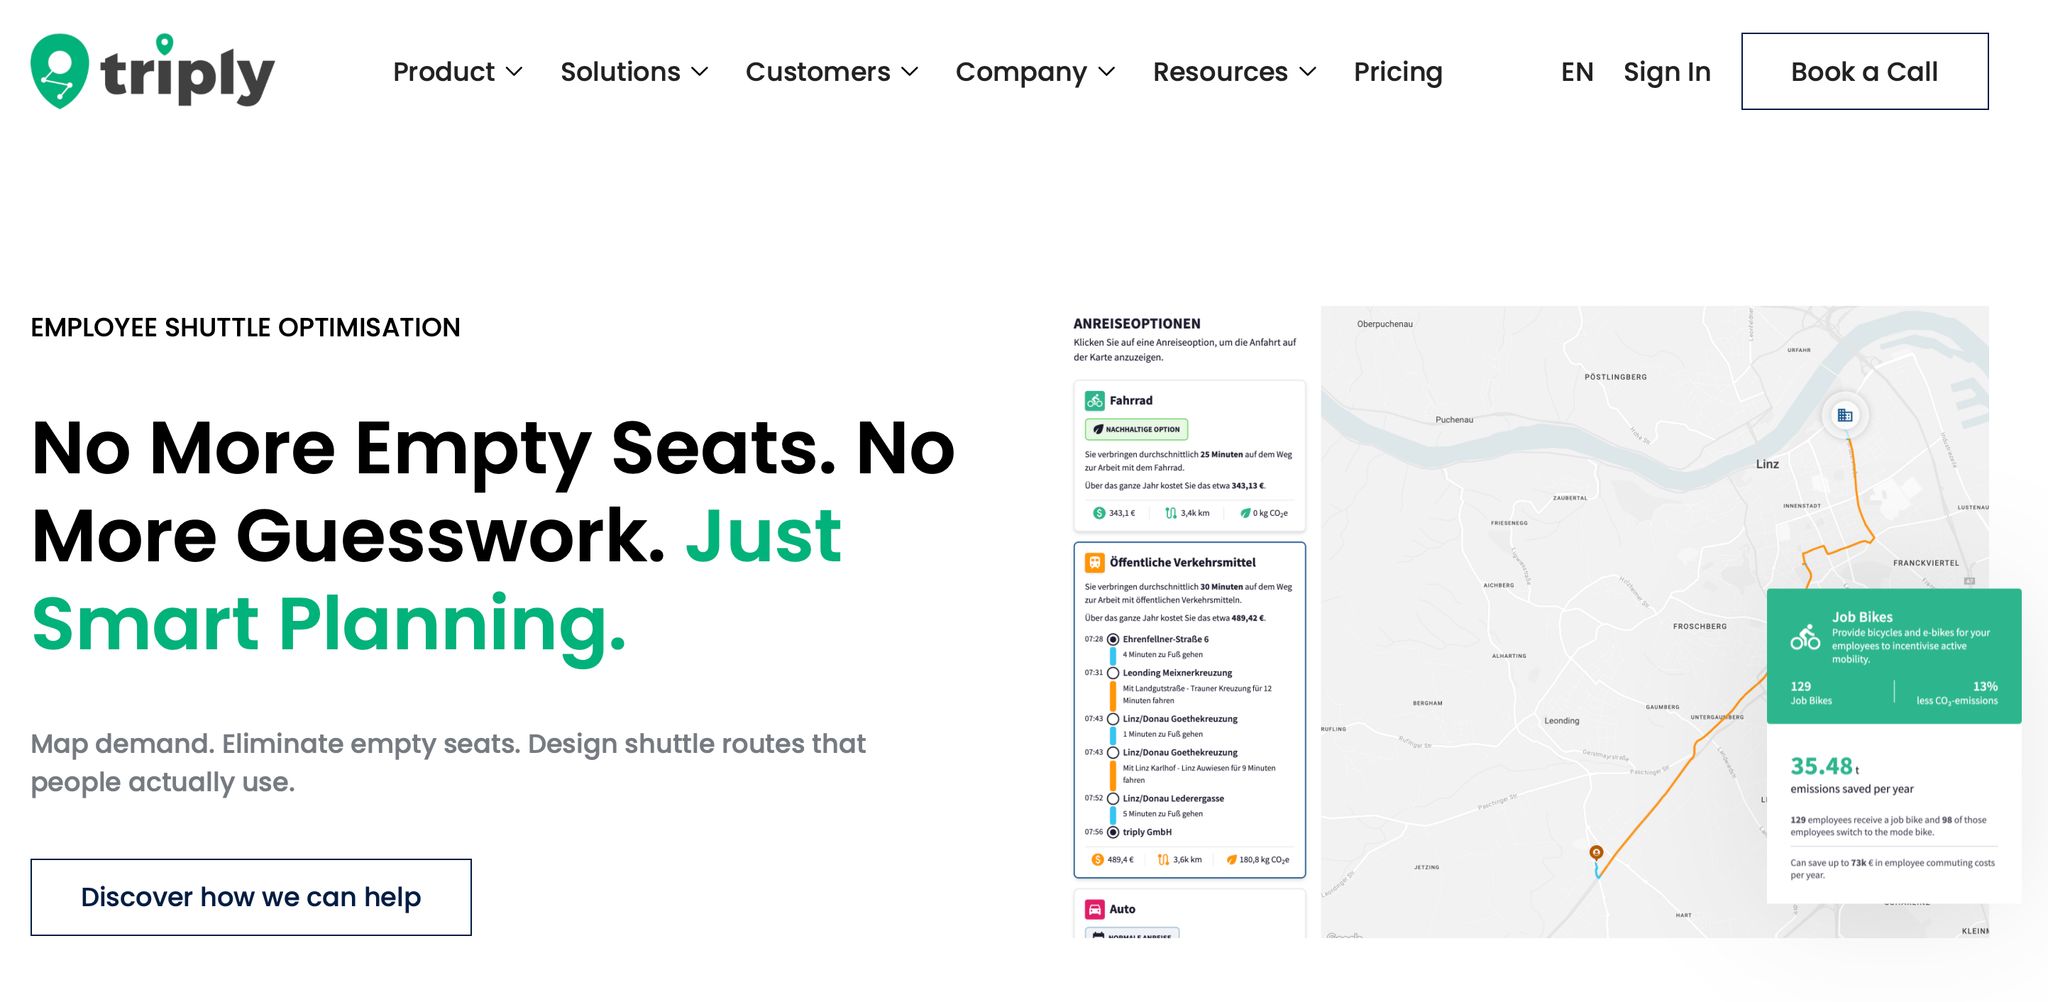
Once you know where commute risk shows up, the next step is simple: model the impact before you change anything. Unsafe or unreliable access can drive attrition before a shift even begins, and triply adds a pre-investment modelling step so you can test what a route change would do before you spend money. Use triply to model commute risk before you change routes, stops, or shifts.
triply builds a site-level commute model using data you likely already have: employee home area postal codes, your plant location, and your shift structure. From there, the platform maps actual commute patterns across your workforce.
That includes:
This gives you a clear view of which stops people can actually reach on time. From there, you can test whether a route, stop, or shift change closes the access gap or just looks good in a planning deck.
Model route, stop, and shift changes before you spend, then compare the effect on coverage, load factor, cost per boarded rider, and Scope 3 Category 7. You can test a new stop location, a redesigned route, staggered shift departures, or a public transit subsidy and see the projected effect before a single euro is spent.
The goal is straightforward: find out which change lowers commute friction before it turns into absence or exit. And the upside is bigger than model precision. It helps you avoid changes that seem sensible on paper but do little for retention or cost.
After you test scenarios, the next move is to turn that result into a budget case.
The model gives finance, HR, and sustainability teams a shared decision base. Instead of each team working from separate files, assumptions, or reporting tracks, they work from one dataset and one scenario set.
That matters because one scenario set is easier to approve when it shows cost, access, and emissions together. When budget holders can see the projected change in cost per boarded rider next to the expected improvement in stop access, the discussion shifts from opinion to evidence.
Because Scope 3 Category 7 sits inside the same model instead of living in a separate reporting exercise, sustainability does not need to run a second process to get the numbers it needs.
Use the model to cut commute risk, reduce avoidable spend, and support the approval you need.
At many plants in Mexico, attrition starts long before HR spots a pattern. It starts at the bus stop.
If workers can’t get to a stop with ease, if the waiting point feels unsafe, or if the shift timing doesn’t line up with the route, absence and exits tend to climb. And by the time those issues show up in HR data, the damage is already done.
The smart move is to model that risk before you spend money. Site-level commute modelling shows you where access breaks down and what it would cost to fix it. Start with the site, then test route, stop, and shift changes before you lock in budget. That gives you a finance-ready case tied to lower attrition, lower waste, and better transport spend.
Use these checks in your next transport review:
If the model shows a gap, test the fix before budget approval. Book a demo with triply to run the numbers before your next transport review.



