
Treat commute data as a shared, traceable model to link cost control with CSRD Scope 3 Category 7 reporting.

Employee commuting is no longer just a budget issue. It can now sit in your CSRD reporting too.
If Scope 3 Category 7 is material for your company, you need more than a rough estimate. You need a clear method, traceable data, and a process you can use again across sites and reporting periods.
Here’s the core point in simple terms:
For large multi-site employers in Germany, this means commute management now has two jobs at once:
A few metrics now matter on both sides:
The short version: if finance, HR, sustainability, and site teams all work from different files, the numbers can drift. But if you build one traceable commute model from postcode, shift, route, and uptake data, you can test measures before committing € budget and use the same base for reporting.
| Area | What is needed |
|---|---|
| Cost control | Track route use, rider cost, and service demand |
| Reporting | Show method, source data, assumptions, and coverage |
| Best setup | One dataset used for both |
So the article’s message is simple: commute optimisation is now both a money question and a reporting question. And the companies in the best position are the ones that treat commute data as a shared business input, not as a one-off estimate.
At many large employers, commute data is still scattered. One team has a spreadsheet. Another has partial shuttle data. HR may run an employee survey once a year, and the response rate is often low.
The result? Each data set lives in a different system, sits with a different team, and updates on its own timeline.
That may be fine for budgeting. It is not fine for disclosure.
Cost control can live with estimates. CSRD reporting cannot. That’s where reporting discipline starts to matter.
Scope 3 Category 7 reporting needs inputs you can trace back and explain. That includes:
A low-response survey or a one-off estimate can plug a gap for a single report. But it is tough to reproduce, even tougher to line up across sites, and weak under limited assurance.
That leads to the next issue: which commute metrics can work for both cost control and reporting.
The same commute activity now has to answer two things at once: what you spend and whether you can back up Scope 3 Category 7.
That changes the job. Commute data is no longer just about running services at a sensible cost. It also needs to stand up in reporting.
If you run commute services for your workforce, you’re likely already tracking a small set of operational KPIs.
Load factor shows how much of your available capacity is actually being used. If load factor is low, you’re paying for seats or vehicle space that sits empty. Cost per boarded rider gives you a unit-cost view of each boarding, which makes it easier to compare routes or sites on the same basis.
These are the day-to-day numbers that help you see where money is going and where service levels may not match demand.
Scope 3 Category 7 reporting uses much of the same activity data, but it asks a different set of questions.
Under CSRD and ESRS E1, you need to evidence Scope 3 Category 7 emissions and show the data coverage behind them. That means your activity data has to be consistent, checkable, and reusable across sites and reporting periods.
In plain terms, it’s not enough to have rough figures. You need data you can trace, review, and use again without rebuilding the whole picture each time.
The smart move is simple: use one activity dataset, then split the job into two views, one for operational efficiency and one for reporting evidence.
| KPI | What it measures | Use in cost control | Use in reporting |
|---|---|---|---|
| Load factor | How fully you use available capacity | Helps you spot underused routes and capacity | Indirect support for activity evidence |
| Cost per boarded rider | Route cost per actual boarding | Core unit-cost metric for comparing routes or sites | Helps you understand the cost impact of service changes |
| Scope 3 Category 7 emissions | Reported emissions from employee commuting | Not a cost metric | Core reported figure under CSRD and ESRS E1 |
| Data coverage | How much of your workforce is represented in the data | Improves confidence in planning decisions | Important for defensible reporting |
That’s why the next step is one model that tests cost impact and reporting impact before you commit.
Those shared KPIs only help if the commute data underneath them is built once and then used across teams. That’s the core idea here: the same activity data supports both cost control and Scope 3 Category 7 reporting, so it makes sense to use one commute model from the start.
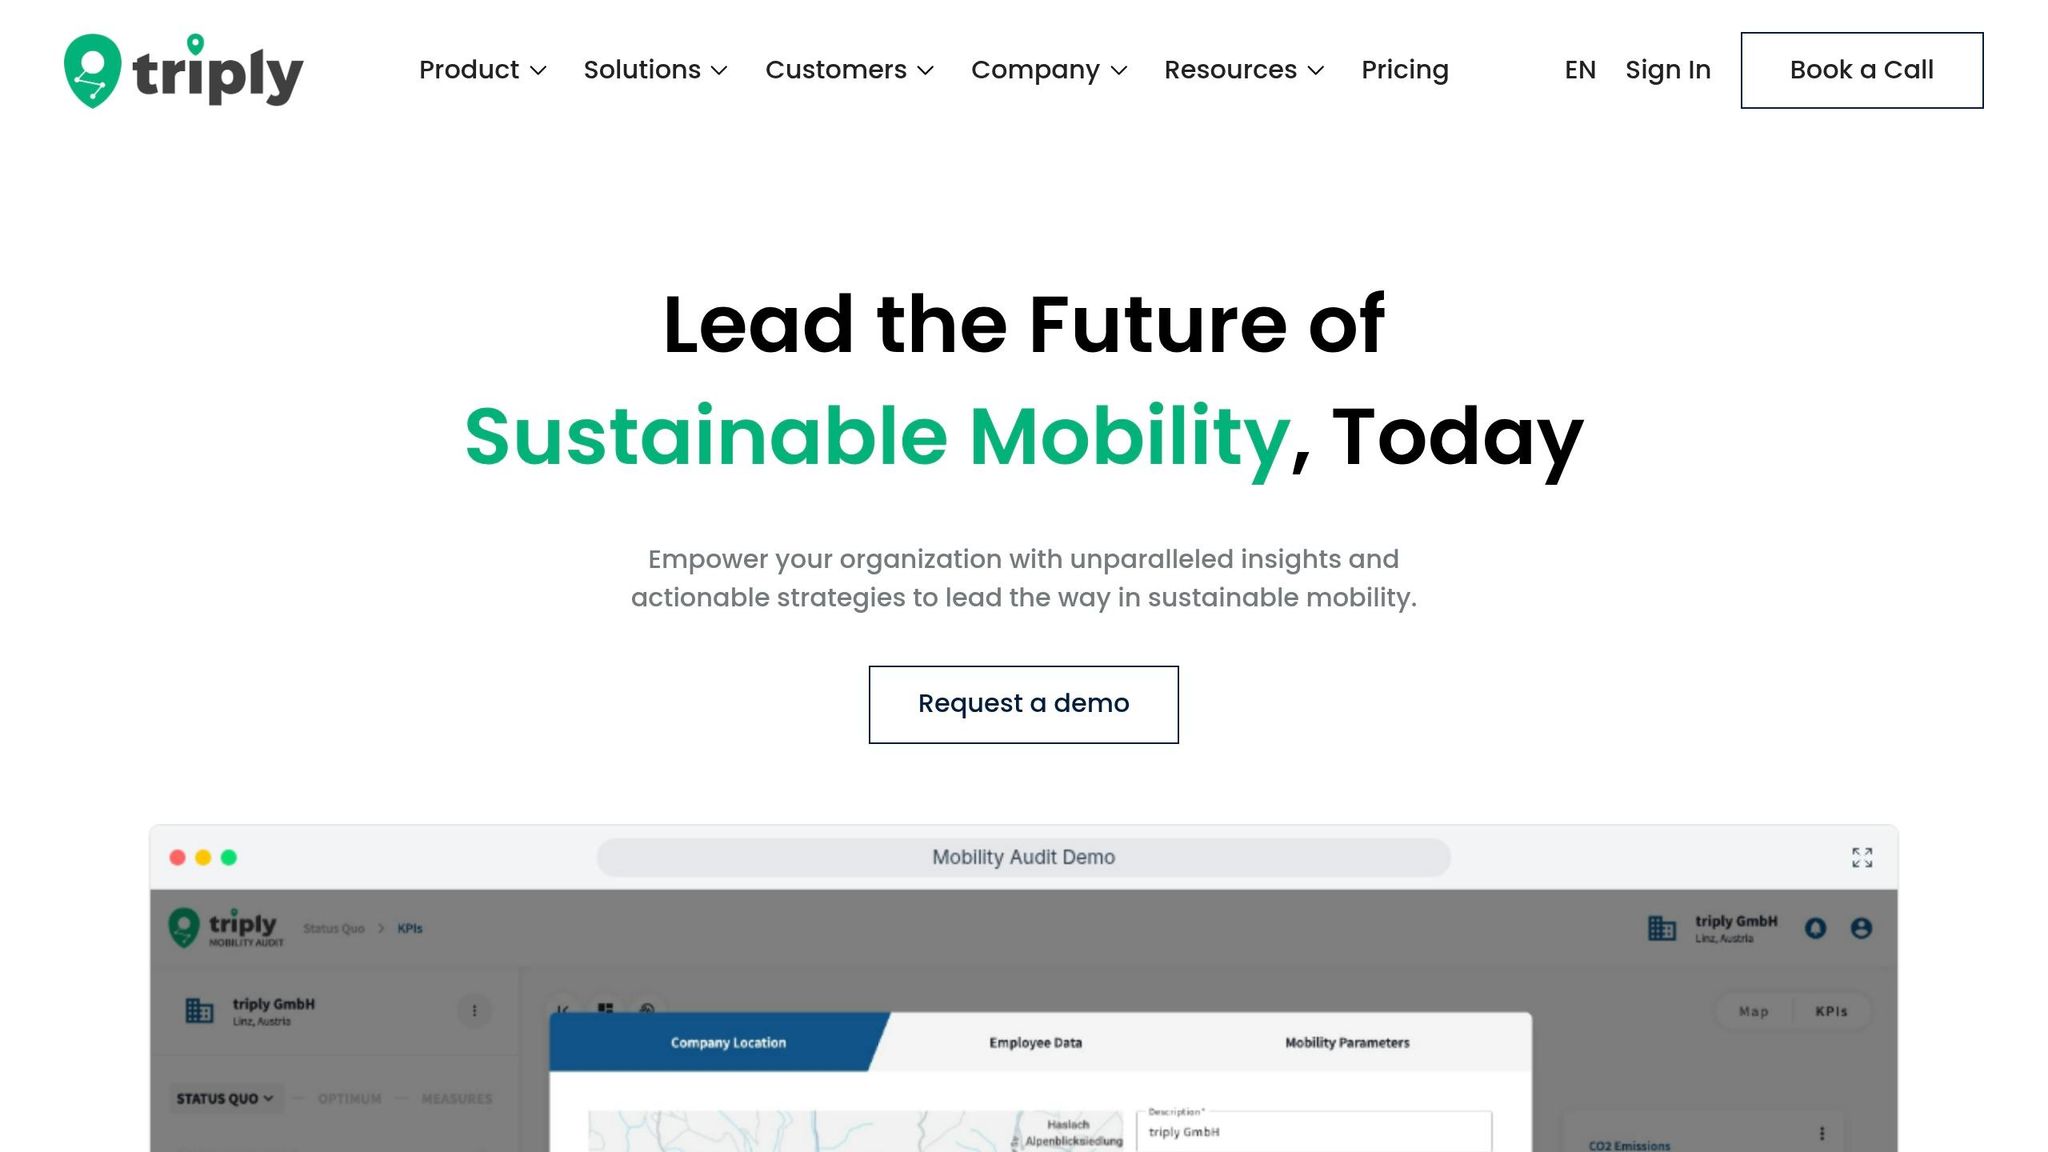
triply starts with data many companies already have, such as postcode and shift data. From there, it maps how people travel by site and by shift, because commute patterns often change from one location to the next. An early shift at one plant can look very different from an office-based day shift somewhere else.
triply brings that site and shift data into one shared view for finance, operations, and sustainability. So instead of three teams working from three different assumptions, everyone looks at the same traceable base. That helps with budget planning and reporting at the same time.
The part that stands out is pre-investment simulation. Before you put money into a new shuttle route, a public transport subsidy, or a carpooling programme, you can model the likely effect on:
That matters because spending on mobility without testing the likely outcome first can feel a bit like buying a train ticket without checking where the train goes.
When you test a measure in triply, you see the cost side and the reporting side next to each other. That makes trade-offs much easier to judge.
A shuttle route change, for example, may lift load factor and lower cost per boarded rider. A public transport subsidy may cost more, but it could cut Scope 3 Category 7 emissions more sharply. Looking at both outcomes in one model helps you compare measures on more than just price.
This kind of testing before budget is committed helps teams put money into measures that support cost control and reporting at the same time. It also builds traceability into the model from day one. In plain terms, the same evidence base used for budget choices can also back up your Scope 3 Category 7 reporting.
The table below shows how different measures can affect cost and reporting in different ways.
| Mobility measure | Cost impact | Scope 3 Category 7 reporting impact | Data and traceability |
|---|---|---|---|
| Shuttle optimisation | Can improve load factor and reduce cost per boarded rider when capacity matches actual demand | Can improve reporting when it replaces less efficient commute arrangements | Route and boarding logs support traceability |
| Public transport subsidies | Adds subsidy cost, but can shift commute choices | Can be meaningful if it shifts trips away from private cars | Uptake tracking helps you support the reported modal shift |
| Carpooling programmes | Can reduce employer cost when shared rides are used more often | Can reduce commuting emissions when it replaces private-car commuting | Data quality depends on how trip data is captured and verified |
| Flexible scheduling | Can reduce peak-hour capacity needs | Can lower commute emissions indirectly by shifting travel patterns | Shift-pattern data gives you a clear starting point, but the impact still needs modelling |
Effects vary by site and transport mix. General information only, not legal or tax advice.
The same commute model now feeds two jobs at once: budget choices and reporting. So the takeaway is pretty clear. Commuting is now a reported, traceable line item under CSRD and ESRS E1. That changes how companies need to handle commute management. It’s no longer just about cost control. You also need reporting you can stand behind.
In many organisations, cost and reporting sit on separate data sets. That’s where things start to drift. Budget choices go one way, emissions figures go another, and nobody is working from the same base.
A shared commute model fixes that. It gives finance, sustainability, HR, and operations one traceable source to work from. When cost control and Scope 3 Category 7 reporting come from the same activity data, they become two outputs from one consistent, auditable base. That’s why the next step isn’t another estimate. It’s a model you can defend.
Start with one question: can your current commute data support both a budget decision and a defensible Scope 3 Category 7 figure?
Look at the site-level data you already have, spot the gaps, then model your baseline and test measures before you commit budget.
Once you have one traceable base, the next practical step is deciding what to test first. Book a triply demo to test your site data and simulate the measures most relevant to your operation.



