
Make add/cut/reroute shuttle decisions using load factor, cost per boarded rider, on‑time performance and Scope 3 commuting emissions.
If you had to decide on a shuttle route today, you should use four numbers first: load factor, cost per boarded rider, on-time performance, and Scope 3 Category 7 commuting emissions. If seats stay full, you add capacity. If trips stay empty and cost per rider stays high, you cut or combine service. If demand has moved to new PLZ clusters or shifts no longer match the timetable, you reroute.
In plain terms, shuttle planning is not a one-time setup. Staff home locations change, shift times move, and site access points can change too. A route that worked 3 months ago can drift off target fast. That is why you should review route data on a set cycle and test changes before spending money.
Here’s the short version:
| Decision | What to look for | Main signal | Main risk if ignored |
|---|---|---|---|
| Add | High seat use across many trips | Repeated high load factor | Overcrowding and missed demand |
| Cut / combine | Low repeat use and high cost per rider | Repeated underuse | Paying for empty or near-empty trips |
| Reroute | New PLZ clusters, access changes, shift mismatch | Demand has moved | Route exists, but no longer fits staff travel |
A simple rule helps: one busy week or one quiet week should not decide a route. You should look for patterns over time, compare trips by shift, and check whether the route still lines up with where people live and how they get into the site.
That is the core idea of this article: use workforce, route, cost, and emissions data to make shuttle changes that make sense before budget is locked in.
Shuttle optimization means using commute demand, service performance, and emissions data to decide if a route should exist at all, where it should run, and how much capacity it needs. The aim is simple: better load factor, lower cost per boarded rider, and lower Scope 3 Category 7 employee commuting emissions.
This comes before day-to-day shuttle operations. You start with a basic question: does demand support the route? With triply, you can model routes using postal codes (PLZ, Postleitzahl) and shift schedules, then simulate ridership, cost, and Scope 3 Category 7 emissions before changing the service. That gives you room to test which employee, site, and shift inputs support a route change.
Commute modelling helps you test a route change before you commit budget. Day-to-day shuttle operations deal with the service after it is already running.
Use four metrics to compare routes the same way each time.
If you want to use load factor, cost per boarded rider, and Scope 3 Category 7 in a useful way, start with the data behind them.
Most large employers already have three main data groups:
Taken together, they show whether a route issue is actually a route issue, and what kind of change makes sense.
Start by mapping workforce postal-code clusters first (PLZ, Postleitzahl). When employee demand is concentrated in one area, a dedicated shuttle can make sense. When home locations are spread out, it usually doesn’t.
Then pair that with site access points and shift start and finish times. This matters more than it may seem at first glance. A shuttle doesn’t just need to serve the right building. It needs to stop where people can actually enter the site without a long last stretch on foot.
Timing matters too. If trips regularly miss shift changes, that points to a scheduling issue, not a lack-of-demand issue.
These inputs also help you spot stop-to-workstation gaps. If that gap is regularly too large for a group of employees, a reroute or an added stop may fix it.
Once a route is live, the next step is to check whether it still matches current demand.
Occupancy by trip and load factor are most useful when read together. If both stay low across most trips, demand may just not be there. If load factor is low on some trips but high on others, the schedule is probably out of sync with shift patterns.
Cost per boarded rider helps you compare routes on the same basis. It shows where spend is too high for the level of use.
Scope 3 Category 7 adds the emissions view. It shows whether a route change cuts employee commuting emissions.
Use the table below to match each data type to the right action.
| Data Category | Key Metrics | Add | Cut | Reroute |
|---|---|---|---|---|
| Employee and site demand | PLZ clusters, site access points, shift times | Concentrated demand near an unserved site | Sparse, dispersed home locations with no clear cluster | Workforce has shifted to new postal-code clusters or a new access point |
| Operational performance | Occupancy by trip, load factor | Persistently high load factor | Persistently low load factor across most trips | Load factor varies sharply by trip, suggesting a timing mismatch |
| Financial | Cost per boarded rider | Projected improvement in cost per boarded rider | Cost per boarded rider remains too high for the ridership level | Rerouting improves cost per boarded rider |
| ESG | Scope 3 Category 7 emissions per commuter | Reduces Scope 3 Category 7 emissions for a clustered employee group | Low ridership limits emissions impact | Rerouting increases ridership and lowers Scope 3 Category 7 emissions |
These inputs feed the add, cut, or reroute decision rules in the next section.
Use the metrics above to decide if demand calls for more seats, fewer seats, or a different route. In practice, those numbers lead to three actions: add, cut, or reroute. Review these signals on a set cycle, because commute patterns don’t sit still.
Add capacity when load factor stays high across several trips over time. One busy week can come from a one-off event. But if the same pattern keeps showing up, you’re likely looking at a steady capacity shortfall.
Also check whether the same home cluster keeps getting left out. If a large group of employees is clustered around an unserved stop or site, that gives you unmet demand you can measure.
Before you commit budget, model the added trip in triply. You can test an extra trip or a different stop pattern, then look at the projected effect on load factor and cost per boarded rider before making a change.
If demand isn’t the issue, move to the next test: underuse that keeps showing up.
Low ridership on its own isn’t enough to cut a route.
Look for a pattern instead:
When those signals keep showing up over time, it makes sense to cut or consolidate the route.
If you track Scope 3 Category 7, review it alongside cost per boarded rider so the choice doesn’t mask an emissions trade-off.
When demand is there but the route still performs poorly, the problem is usually alignment, not volume.
Reroute when employees have moved, new home clusters have formed, or site access has changed. The main question is simple: does the route still match current commute patterns? If not, rerouting can improve access and cost per boarded rider.
Model the revised route in triply before you change the service.
A one-off route review shows what was happening at one moment. A repeat review cycle shows what’s changing over time - and what’s driving it.
The simplest way to keep reviews steady is to agree on a fixed set of metrics before you begin. Load factor, cost per boarded rider, shift alignment, and Scope 3 Category 7 emissions cover the main concerns across teams. Operations looks at route performance. HR wants service that lines up with actual shift patterns. Finance cares about cost control. Sustainability needs emissions accountability. When everyone works from the same numbers, decisions tend to move faster and disputes get smaller.
Set a review rhythm that fits your organisation. A regular full review, with a lighter check-in between those reviews, helps you spot early changes without waiting too long. The exact cadence matters less than sticking to it.
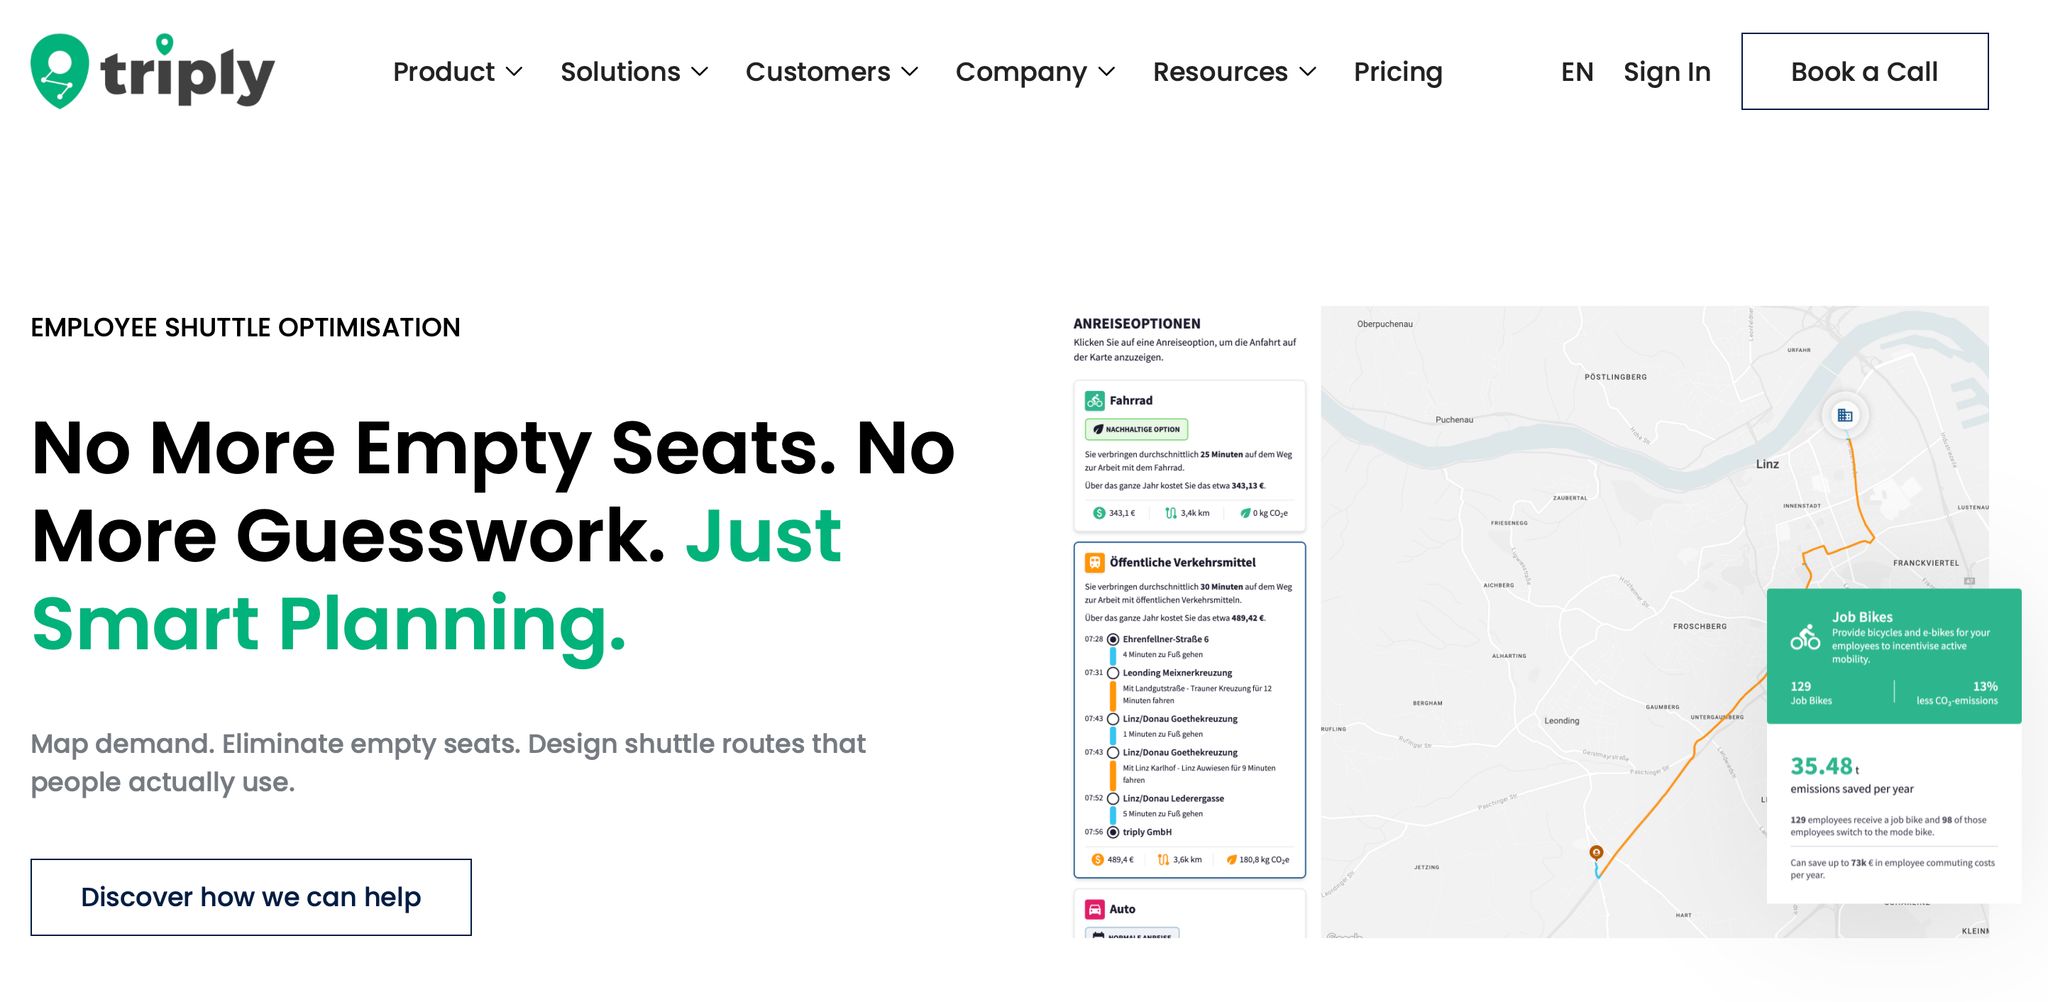
The space between “we think this route change will help” and “we can prove it will help” is where wasted spend often slips in. triply helps close that gap by modelling commute patterns from minimal data, such as postal codes and shift schedules, without the need to survey every employee.
Once that commute view is in place, you can test a proposed change - an extra trip, a consolidated stop, or a rerouted corridor - and see the projected effect on load factor, cost per boarded rider, and Scope 3 Category 7 emissions before changing a single schedule. For employers with multiple sites, triply brings demand across locations into one consistent model, so a change at one site doesn’t create a blind spot at another. You can explore the full approach to employee shuttle optimisation with triply before booking time with the team.
Shuttle optimisation isn’t a project you finish and forget. Workforces shift. Home clusters move. Public transport networks change. Cost pressure changes too. The employers that get the most from their shuttle investment are the ones that treat the review cycle as a standing process, not a one-time fix.
The right move - whether that means adding, cutting, or rerouting service - depends on the mix of demand signals, operational performance, cost per boarded rider, and emissions context. Simulation helps you test that mix before you spend. If you want to see how triply models your commute data and simulates route changes, book a demo.
Review shuttle routes on a regular basis as your workforce shifts. The aim is to use current commute data to decide whether to add, remove, or reroute services, instead of treating shuttle optimisation as a one-time task.
This is general information, not legal or tax advice.
Before you change a shuttle, get up-to-date commute data first. You need a clear view of how employees are travelling now and where demand has shifted.
Then use that data to decide if you should add routes, cut underused services, or reroute existing shuttles as your workforce changes.
Reroute instead of cutting a route when commute data shows the service is still needed, but demand has shifted. This supports continuous shuttle optimization as your workforce changes.
Use current commute data to check whether a route still lines up with where and when employees travel. If demand has moved, adjust the route instead of removing the service.



