
Use load factor, cost per rider, on-time and CO2 metrics with monthly commute models to decide whether to add, reroute, or cut shuttles.

If we had to boil this down to one rule, it would be this: Add service when demand stays high, reroute when demand moves, and cut only after you test other fixes first.
That decision comes from a small set of numbers, not gut feel. Firstly, a look at load factor, cost per boarded rider, on-time performance, door-to-door travel time, and CO2 per rider. Then, a review of them by route, shift, and day of week, so one bad week does not drive a bad decision.
Here’s the short version:
A useful target range in the article is 60% to 80% load factor in peak hours. Below that often means too many seats. Above that often means crowding. But low ridership alone does not prove a route should go.
| Decision | What to look for | What to do first |
|---|---|---|
| Add | Load factor stays above target | Test another run, bigger vehicle, or new line |
| Reroute | Demand has shifted by PLZ or timing | Retime stops, merge stops, adjust route shape |
| Cut | Low load factor stays low and € per rider keeps rising | Test reroute, retime, and replacement options first |
Shuttle planning should be treated as a monthly review loop. Update the commute model, test changes in simulation, and act only when the pattern holds over time.
Start with the data you already have, then update the model as your workforce changes.
Use employee home postal codes (PLZ, postal codes), shift patterns, work schedules, site entrances, current routes and timetables, vehicle capacity, ridership logs, and nearby ÖPNV (public transport) options, including S-Bahn (urban rail), U-Bahn (metro), and Regionalbahn (regional rail) connections.
Pull PLZ data straight from your HRIS system instead of leaning on self-entered surveys. Survey data gets old fast. HRIS data shows who is on your roster today. Also include walk time from the drop-off point to the badge-in point, plus any security screening time. Those are the inputs you need before testing any route change.
Model demand by site and shift, not by route. Group employees into residential clusters by PLZ, then map those clusters to site entrances and shift windows. That makes it easier to spot the corridors where demand is concentrated and where service overlaps.
If employees live near an S-Bahn or Regionalbahn station, treat the shuttle as a last-mile feeder instead of running a long-haul route. triply Analyse and triply Consolidate keep one current commute model consistent across sites [1].
Once the model shows where demand sits, use it to set the baseline for route performance.
Before changing a route, map origin patterns, underserved corridors, overlapping services, and timing gaps between local ÖPNV and production starts. Keep the baseline current with daily roster imports, and review route structure when site layouts or shift patterns change.
With the baseline in place, track load factor, cost per boarded rider, service quality, and emissions against current demand.
Use a small set of metrics to sort the problem into one of three buckets: too much capacity, poor timing, or the wrong route. That makes decisions a lot less guessy. Instead of reacting to one noisy week, you can see what’s actually going wrong.
Use load factor to compare seat capacity with demand. A common peak-hour range is 60% to 80%. Below that usually points to underuse. Above that usually points to crowding [6]. If load factor stays low, you may have more seats than you need. If it stays high, the route may need added capacity.
Cost per boarded rider is total route operating cost divided by the number of passengers who actually board. That includes costs like fuel, driver time, and maintenance. It is often the clearest money signal. When load factor is low, cost per boarded rider will often climb too, which helps support a case for merging, rescheduling, or cutting a route [8][3].
A single data point won’t tell you much. The trend is what matters. Review both metrics every month, and break them out by route, shift, and day of week. That way, you’re spotting repeat patterns instead of chasing a one-off bad week [3][5].
Low ridership doesn’t always mean the route has no value. Sometimes the bus comes at the wrong time. Sometimes the stop is in the wrong place. That’s why on-time performance and door-to-door travel time should sit in the same monthly review as load factor and cost per boarded rider.
Measure on-time performance against badge-in deadlines, not shift start times. A shuttle can arrive at the stop on schedule and still fail if riders miss badge-in [2]. Door-to-door travel time combines wait time and in-vehicle time. That’s what employees actually feel day to day, and it is the main driver of perceived service quality and employee satisfaction [6][3].
Track CO2 per boarded rider as well, so you can see how occupancy changes affect Scope 3 Category 7 emissions [4][6]. When you review CO2 per boarded rider alongside cost per boarded rider, finance, operations, and sustainability teams can work from the same monthly picture [9][3].
The table below shows how to use each metric:
| Metric | Track by | What it tells you |
|---|---|---|
| Load factor | Route, shift, day of week | Whether capacity matches demand |
| Cost per boarded rider | Route, site | Which routes are financially inefficient |
| On-time performance | Route, shift | Where timing or stop placement is failing |
| Door-to-door travel time | Route, shift | How employees experience the service |
| CO2 per boarded rider | Site, route | Scope 3 Category 7 contribution and where low occupancy is hurting emissions |
Use these metrics to decide whether the next move is to add capacity, reroute, or cut service.
This is general information, not legal or tax advice.
Use your monthly metrics and site commute model to make one clear choice: add capacity, reroute the service, or cut it only after other options don't work. The monthly review helps you figure out what's off. Is it demand? Timing? Or the route itself? Before you change routes or timetables, test the change in simulation against current commute data.
Add capacity when load factor stays above the top of your target range and your commute model shows a cluster of employee origins within a realistic catchment area of an existing or planned stop [6].
Before adding a new run or another vehicle, check a few Germany-specific points. Early and late production shifts, which are common in two-shift or three-shift patterns, often create demand windows that one peak-hour service can't cover [4][2]. Site access limits, such as security gates, can create bottlenecks that make an on-time shuttle feel late [2]. And if your site is close to an S-Bahn or Regionalbahn station, add a delay buffer when you model the connection [5]. That output will show whether you need a second run, a larger vehicle, or a new line.
If load factor isn't the problem, look next at route shape and timing.
Low ridership doesn't always mean demand is gone. Often, it means the route no longer fits where employees live or when they need to travel. Updated PLZ clusters in your commute model can show this fast. If employee origins have moved to a new suburb or district while the route still serves the old one, demand has shifted rather than disappeared [8][2].
Check for hidden demand before you decide a route has failed. High parking use or strong badge-in counts at a certain gate, paired with low shuttle boarding, usually points to one thing: the current service isn't convenient enough [2]. A wave of new hires from a different postcode area can point the same way. In those cases, a small change can go a long way:
Run the revised route in simulation first. That lets you check the projected load factor and cost per boarded rider before going live.
If rerouting still leaves a low load factor, test other options before you cut.
Cutting a route should be the last move, not the first reaction to weak numbers. Work through this sequence before removing a service:
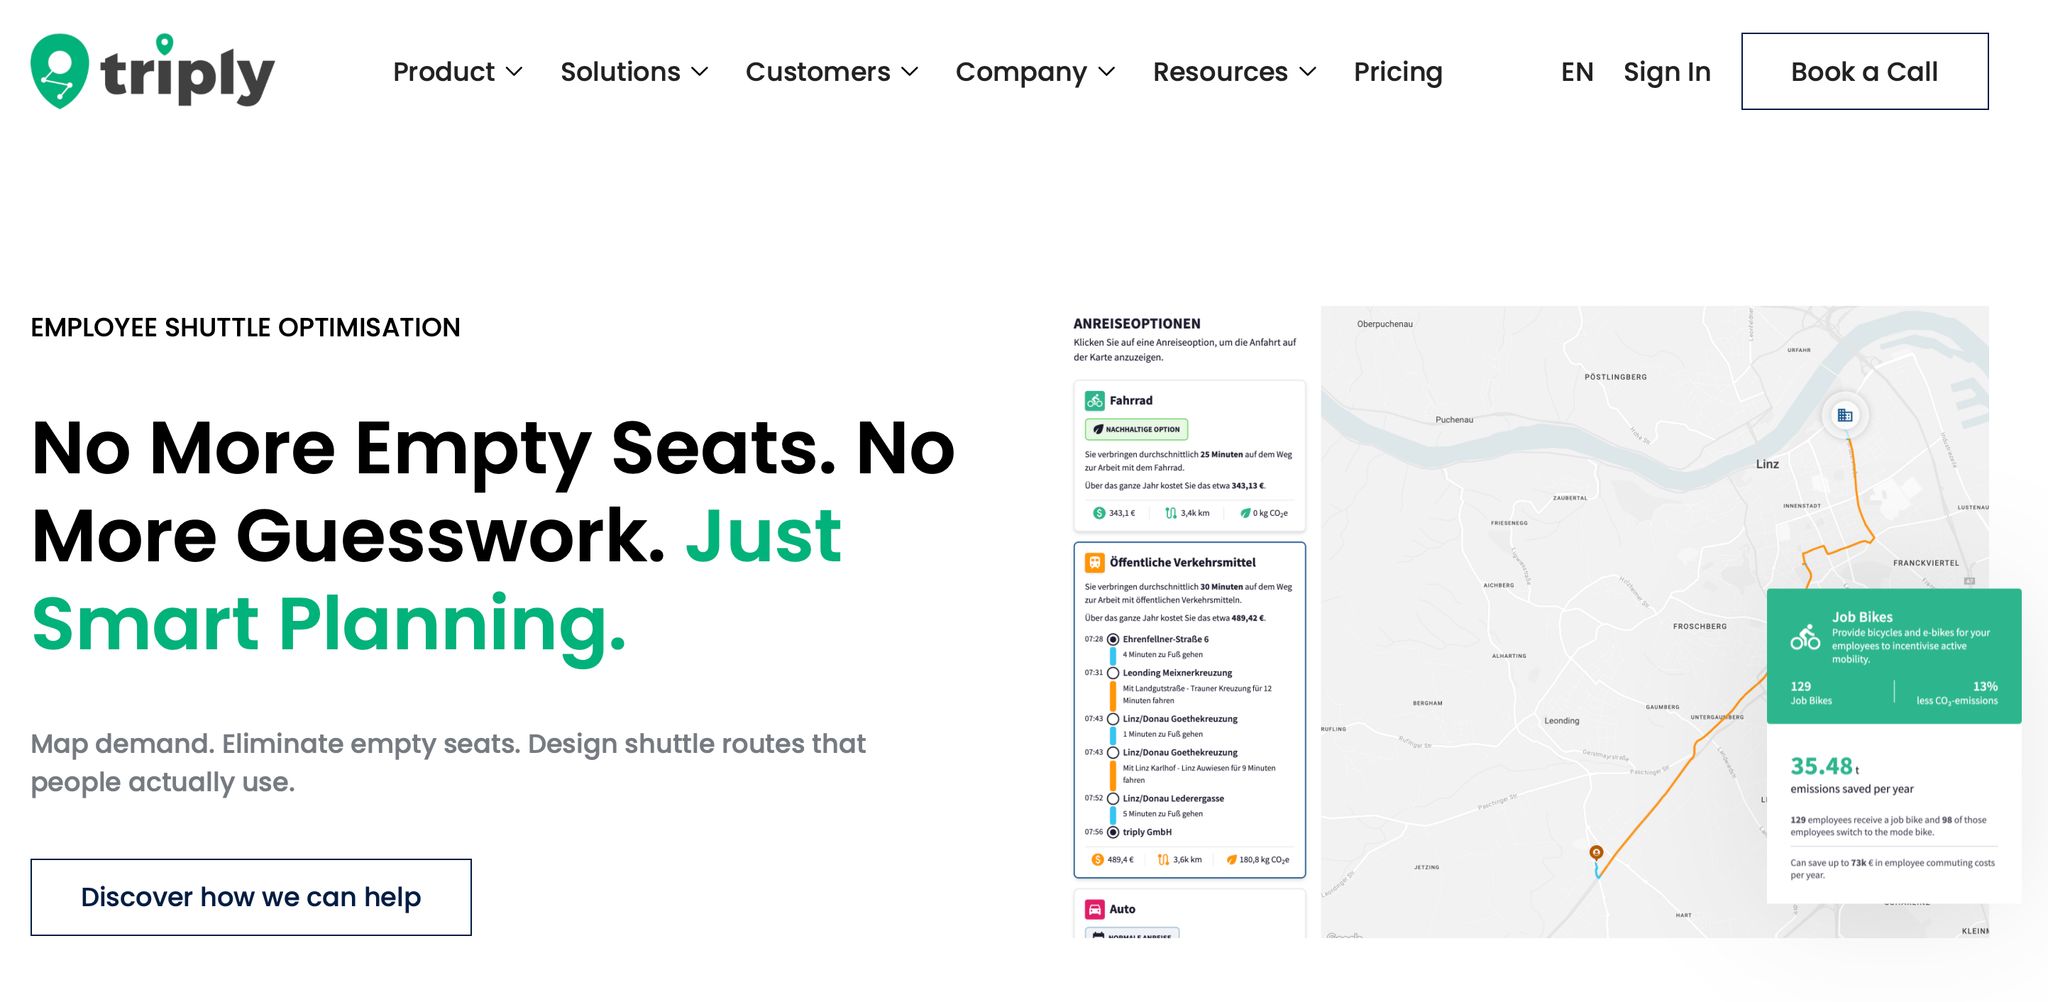
Use the monthly metrics above in a fixed review loop. Run the same check every month. A one-off analysis shows what’s happening now, but a monthly loop shows when demand starts to shift and what you should change.
Finance, mobility, and sustainability all need the same shuttle data, but they use it for different calls. You upload postal code and shift pattern data once, and that same dataset feeds finance analysis, route simulation for mobility planning, and Scope 3 Category 7 reporting for sustainability [1][3]. That means every team works from the same data set instead of comparing different spreadsheets and assumptions.
Once the model is up to date, run the same route test every month so results stay comparable.
If you manage more than one site, triply consolidates data across plants and locations into one consistent picture [1].
Monthly shuttle optimization means updating the model, testing route changes in simulation, and acting only when demand holds over time.
If you want to see how triply builds that model for your sites and what your current shuttle network looks like against real commute data, you can book a demo through the employee shuttle optimisation page.
This article provides general information only and does not constitute legal or tax advice.
There’s no single set timeframe for this. Demand can shift with staff rotas, company events, and seasonal patterns, so shuttle optimization works best as an ongoing process rather than a one-off review.
Check your data on a regular basis for small tweaks. For bigger changes, like rerouting or resizing the fleet, look at ridership and badge-in patterns over time so you can spot steady trends instead of reacting to short-term anomalies.
A feeder shuttle is often a better fit than a direct route when you need last-mile connections from transit hubs to your site.
It helps close the gap between regional transport nodes, such as a train station or local transit hub, and your site. In many cases, that means simpler multi-stop routes, better reliability, and a closer match between shuttle capacity and actual demand.
This is general information for educational purposes and not legal or tax advice.
Use more than one data source to forecast ridership. Pull from HR shift rosters, event RSVP counts, and past badge-in patterns instead of leaning on static schedules alone.
Keep capacity flexible, with an illustrative 5 to 10% buffer on days when demand tends to swing. Use booking data to spot peaks, then adjust flex trips fast. Monitor load factor on a continuous basis so you can right-size service. This is general information, not legal or tax advice.



