
Data-first TDM: start with commute data, set one goal, model options, pilot before you spend.

If we had to sum up the playbook in one line: start with commute data, pick one main goal, test the right measure first, and only then spend money.
For a large employer in Germany, that usually means looking at where employees live (PLZ data), when shifts start and end like 06:00, 14:00, and 22:00, and which problem matters most: parking, site access, cost, hiring, or Scope 3 Category 7 commuting emissions.
Here’s the core idea in plain terms:
That matters because the same measure can perform very differently from one site to another. A shuttle may help a remote plant but miss demand at an urban site. A public transport subsidy may work where service is already strong, but do little where the last mile is the problem.
A simple way to think about the four main levers:
| Measure | Best fit | Main question |
|---|---|---|
| Shuttle | Weak public transport or last-mile gap | Will enough people use it at a cost that makes sense? |
| Public transport incentive | Good public transport, low use | Will the subsidy shift enough trips away from solo driving? |
| Carpooling | Clustered origins, parking pressure | Are there enough matchable trips to make it work? |
| Flexible scheduling | Peaks can be spread across time | Can teams start at different times without site issues? |
The playbook’s main point is simple: use one decision framework across all options. Look at uptake, load factor, cost per boarded rider, route fit, and emissions on the same basis. Then use pilot data to rank sites and shifts before putting more than € 0 beyond the test phase into rollout.
In short, this is a data-first guide for choosing the right commute measure at the right site, with less guesswork and a clearer case for finance, HR, sustainability, and site teams.
Before you look at a single measure, lock down two things: one clear primary objective and one reliable baseline. That gives mobility, operations, HR, sustainability, and finance a shared basis for decisions. Without those two pieces, you can't compare measures in a fair way.
Your baseline is also the starting point for commute modelling.
Different goals point to different measures. So first, decide what success should look like.
Common primary objectives include:
It's fine to choose more than one objective. But you should rank them. That ranking makes the trade-offs much easier to handle. If one option cuts parking pressure but costs more per rider, or another helps hiring but does less for emissions, your priority list tells you what matters most.
A good baseline starts with where employees actually live. Postal code (Postleitzahl, PLZ) data shows the geographic spread of your workforce. It also helps you spot which employee catchment areas have usable public transport links and which don't.
Then add shift start and end times, such as 06:00, 14:00, and 22:00. Now the picture gets sharper. You can see where demand clusters and where it spreads out.
Beyond home locations and shift times, your baseline should also track current shuttle usage, public transport access, and parking limits at each site entrance. Those inputs show where the gap to your goal is largest.
Illustrative example: If PLZ data shows that many employees live within 5 km of an S-Bahn (suburban rail) station with a direct connection to your site, model a transit-based measure. If the data shows dispersed home locations with no viable rail or bus link, a shuttle is more practical.
Pick one standard metric set now and keep it the same across sites and review cycles. Use metrics tied to your objective, such as load factor, cost per boarded rider, or Scope 3 Category 7 emissions.
That consistency matters. Finance can compare results across locations, and operations can act on the same numbers without changing the rules every few months.
Once the baseline is fixed, you can compare shuttles, transit incentives, carpooling, and flexible scheduling on the same terms.
Now that you have a baseline, the next step is pretty simple: match each lever to the commute problems your site actually has.
Large employers usually have four main options: shuttles, public transport incentives, carpooling, and flexible scheduling. But not every option works everywhere. The right fit depends on three things: where the site is, where employees live, and how shifts are set up.
Use shuttles when public transport doesn’t serve your site well, or when the last mile is the main issue.
Use public transport incentives when service is already good, but too few employees are using it.
Use carpooling when employee origins are clustered and parking is under pressure.
Use flexible scheduling when you can spread peak demand across different times without disrupting operations. It’s worth being clear here: flexible scheduling changes when people travel, not how they travel.
Use the same framework for all four levers. That way, you’re judging each option on the same basis: cost, adoption potential, operational fit, and emissions impact.
| Lever | Typical fit condition | Most important questions |
|---|---|---|
| Shuttle | Public transport poorly serves your site or last-mile gaps exist | Can you connect the site reliably, at acceptable cost, with meaningful emissions impact? |
| Public transport incentive | Strong public transport already exists, but adoption is low | Will the incentive increase adoption enough to justify the cost? |
| Carpooling | Origins are clustered and parking is tight | Can you create enough matches to improve operational fit and reduce parking pressure? |
| Flexible scheduling | Peaks can be spread across time | Can the site absorb different start times without disrupting operations? |
Use the table as a screening tool. Your baseline shows which of these fit conditions are actually present, instead of leaving you to guess.
Most large sites don’t have one single commute pattern. One group may struggle with access, another may need parking, and another may be tied to strict shift times. That’s why a single lever rarely solves the whole problem.
A mix of measures usually works better because it lets you address access, parking, and shift-pattern issues at the same time.
Those differences then become the inputs for commute modelling in the next section.
Once you know which levers make sense for your site, commute modelling helps you see which ones deserve budget. The baseline gives you a starting point. From there, you can test each measure against actual demand instead of gut feel.
Without modelling, you're backing assumptions. With modelling, you can estimate demand, uptake, cost, route feasibility, and Scope 3 Category 7 impact before you commit money.
That matters even more when sites have different catchment areas and shift patterns. A measure that works well at one site can fall flat at another. Commute modelling won't remove all uncertainty. Nothing will. But it gives you a decision-ready estimate that finance and operations can review without guesswork.
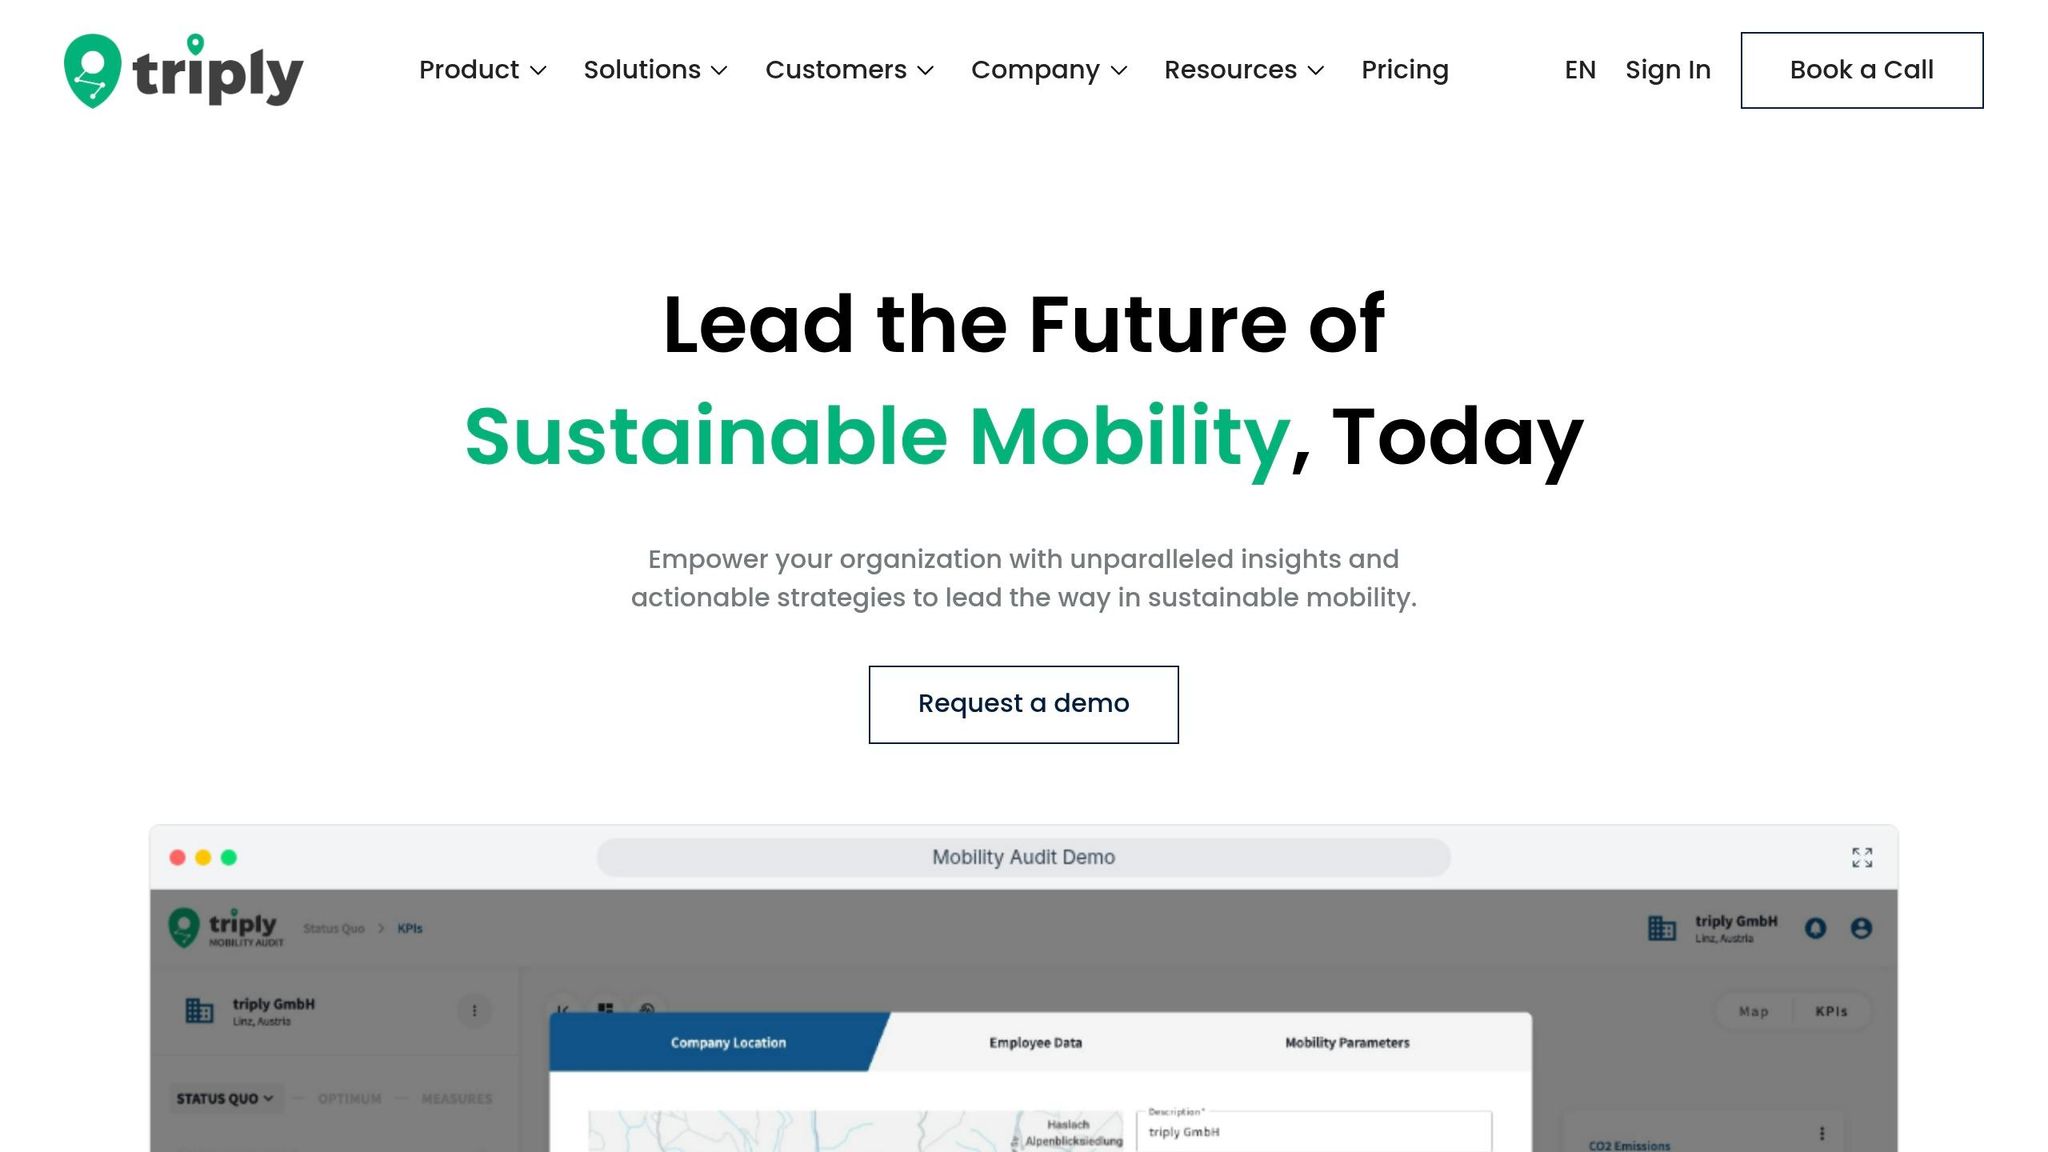
triply builds a commute model from baseline data you may already have, such as PLZ and shift patterns, without needing a full employee survey. It then tests each measure from the same baseline and under the same assumptions.
Here’s how that works:
This gives finance, sustainability, and operations one shared decision base. So instead of each team working from a different version of the story, they can compare options on the same footing and decide what to test next.
Before you approve a pilot or sign off on budget, the modelling output should answer five plain questions:
These outputs let you compare a shuttle, a transit incentive, and a carpooling scheme on a like-for-like basis. If the model shows specific figures, such as projected uptake percentages or cost-per-rider estimates, those figures should be marked as illustrative until real pilot data confirms them.
That kind of transparency is what makes the business case believable. It also gives you a clear base for the pilot.
This is general information, not legal or tax advice.
Once the model gives you a decision-ready estimate, the next step is simple: test it in the field.
Before launch, lock in your baseline and your success targets. That matters more than most teams think. If you change the goalposts halfway through, the pilot stops being useful.
Run the pilot long enough to smooth out novelty effects and seasonality. A one-week spike can look good on paper and still tell you very little. Check results against the baseline at regular intervals so you can see whether the pattern holds.
Use the same metrics you already defined in the baseline:
If the pilot hits most of its targets, scale it. If it doesn’t, pause and find the gap before spending more. Sometimes the issue is the route. Sometimes it’s shift timing, uptake, or site fit. Either way, it’s better to fix the problem early than roll out something that looked good only in theory.
Use pilot results to rank sites by impact and feasibility. Not every site needs the same measure, and not every site should move on the same timeline. Splitting budget evenly may feel safe, but it often spreads money too thin and weakens results.
A better move is to phase investment toward the sites where modelling and pilot data point to the best return.
| Site or Shift | Primary Objective | Feasibility | Expected Impact | Priority |
|---|---|---|---|---|
| High-density urban site, standard shifts | Reduce parking pressure | High | High | Start here |
| Suburban site, split shifts | Cut commuting emissions | Medium | Medium | Second phase |
| Remote site, night shifts | Improve staff retention | Low | High if funded | Assess cost first |
| Mixed-use site, flexible hours | Reduce single-occupancy commuting | Medium | Medium | Pair with scheduling change |
Update the table with pilot data and re-rank sites as results come in. That way, your rollout plan stays tied to evidence instead of guesswork.
Once you know what works at pilot scale, use that proof to build the rollout case. The biggest mistake is picking a lever before you know it fits the site. Modelling helps close that gap. It turns pilot results into a scale-up decision instead of treating each site like a separate experiment.
triply's employee shuttle optimisation modelling shows how pre-investment commute modelling and measure simulation work in practice for large employers. Book a demo with triply to test your site against real commute data before you commit budget.
You don’t need perfect commute data to get started. Use the commute information you already have to build a first view.
Then improve your coverage and level of detail over time as you test different options and measure the impact.
Start with a pilot that’s practical and backed by data for your sites. This playbook focuses on core transportation demand management levers like shuttles, transit incentives, carpooling, and flexible scheduling.
Use modelling to compare these options and estimate likely impact before you scale.
Use modelling to make transportation demand management evidence-based. Link each measure to day-to-day outcomes and financial effect, then compare forecast performance with actual performance over time.
Keep the case practical and tied to the site. State assumptions clearly, track outcomes you can measure, and present the case in a format that finance and operations can review without friction.



