
Map commutes, model uptake and costs, and compare shuttles, carpooling and transit to cut costs and Scope 3 emissions.

Employee commuting can drive 10% to 30% of a company’s total emissions. In simple terms, sustainable employee mobility means helping people get to work with fewer solo car trips, lower travel spend, and fewer access problems at the site.
If we strip the topic down to the basics, this is what matters:
That usually means looking at measures such as:
The article’s core message is simple: don’t pick commute measures on instinct. First map where staff live and how they travel. Then model likely uptake, cost per rider, and emissions change before you commit € budget.
Commuting shapes cost, emissions, and how easily people can get to your site. Parking alone can eat up a lot of capital, and even half-empty spaces still take up land that could be put to better use.
A car-only commute model can also leave operations exposed. If traffic builds up or the car park is full, people turn up late or don’t make it in at all. For manufacturers and multi-shift sites, even a small number of late arrivals can throw off production [2]. When fewer people rely on one mode of travel, arrival risk is spread out, and site access becomes easier to plan around.
Longer commutes can also push up turnover and absenteeism. That tends to show up pretty quickly in HR and finance data.
This stops being just a reporting topic as soon as you look at who shapes commuting outcomes day to day. Shift patterns, site location choices, employer-backed transport, and parking policy all influence how employees travel. And those levers don’t sit with the sustainability team alone.
Finance needs a clear view of commuting to estimate avoided parking capex and turnover costs. Operations needs it to plan shift start times and manage site access. Sustainability needs it for auditable Scope 3 Category 7 disclosures. If your organisation is in scope, you must disclose material Scope 3 emissions, including Category 7, so commute data quality matters. And that same data isn’t only for reporting. It’s also what planning depends on.
When finance, operations, and sustainability work from the same baseline, decisions on shift design, transport spend, and site planning tend to line up faster. That baseline gives you a practical way to compare measures before you commit money.
Start by mapping home postcodes, current travel modes, and how often people commute. That gives you a baseline.
Why does that matter? Because it shows how your workforce is spread out. You can see whether employees cluster along a rail corridor, sit across a broad catchment area, or live in places with no practical public transport link. And once you can see those patterns, the next step gets much easier.
They point you to the measures worth testing. You can spot where a shuttle might make sense, where public transport support could remove a clear barrier, and where carpooling has a decent chance of working.
That baseline tells you which measures are worth modelling first.
A few measures come up again and again, and for good reason.
Shuttle and route services can work well for sites with weak public transport access. Fixed routes tend to suit dense, predictable demand. If employee origins are more spread out, or if hybrid working means demand changes by day, on-demand shuttles can cut the risk of running vehicles with a low load factor on quiet days.
Public transport support can include employer-subsidised tickets, season loan schemes, and last-mile links from the station to the site. If people avoid rail because the final kilometre is awkward or unreliable, deal with that problem head-on.
Carpooling schemes can also do more than many employers expect. Research suggests 55% of commuters would consider car sharing as an alternative to driving alone, yet only 12% currently use it [1]. A structured carpooling scheme, paired with reserved parking for shared vehicles, can help close that gap without a large capital outlay.
Flexible scheduling and remote work, where operations allow it, cut trips at the source. For office-based roles, even a partial drop in peak-day commuting can reduce Scope 3 Category 7 emissions.
Next, compare those options on the same metrics before you spend.
Use the same yardstick for each option. Look at load factor, cost per boarded rider, Scope 3 Category 7, and site reliability. That lets you compare shuttle and route services, carpooling, public transport support, cycling support, and flexible work on a like-for-like basis.
| Measure | Best fit | What you test first |
|---|---|---|
| Flexible work / remote | Office-based roles | Whether you can remove trips without disrupting operations |
| Carpooling scheme | Large sites with shared shift patterns | Corridor density and likely uptake |
| Public transport support | Urban or suburban sites near rail | Last-mile barriers and station access |
| Shuttle and route services | Remote sites or poor transit access | Load factor and route coverage |
| Cycling support | Urban and suburban sites | Cycling access and likely uptake |
| Workplace EV charging | Car-dependent workforces | Parking demand and charging needs |
It often makes sense to begin with lower-complexity measures. They bring less financial risk if uptake falls short of forecast. Then, once you have a better read on demand, you can model higher-capital options such as shuttles and workplace EV charging before committing budget.
Once you’ve shortlisted your measures, compare them with the same metrics and from the same starting point. That means using the same baseline data you used in the shortlist stage.
Use one metric set for every option, so finance, operations, and sustainability teams are all looking at the same picture.
| Metric | Definition | Why it matters |
|---|---|---|
| Mode split | Share of employees by transport mode | Shows whether behaviour is changing |
| Trip frequency | How often employees commute | Helps size demand and spot peak-load patterns |
| Load factor | Riders divided by vehicle capacity | Shows whether vehicles are running half-empty |
| Cost per boarded rider | Total operating cost divided by completed rider trips | Gives finance a clear, comparable efficiency figure |
| Commuting emissions | Total kgCO2e from employee travel, calculated from distance and mode-specific emission factors | Used for emissions tracking and net-zero planning |
| Scope 3 Category 7 emissions | GHG Protocol designation for employee commuting emissions | A large, controllable emissions source, not just a reporting line item |
Once you can measure your baseline, the next step is to model likely outcomes before you spend money.
Survey data can blur change from one year to the next, especially in large workforces. And in shift-based teams, what people say they’ll do doesn’t always line up with what they do in practice. Someone may say they’d use a shuttle. Launch data may tell another story.
Pre-investment modelling helps close that gap. It uses existing HR data, such as home postcodes and shift patterns, to estimate uptake and cost before you commit budget [2]. That gives you a clearer view of low-uptake cases and lets you compare measures using cost per boarded rider before any money is locked in.
That sets up the site-specific decisions covered in the next section.
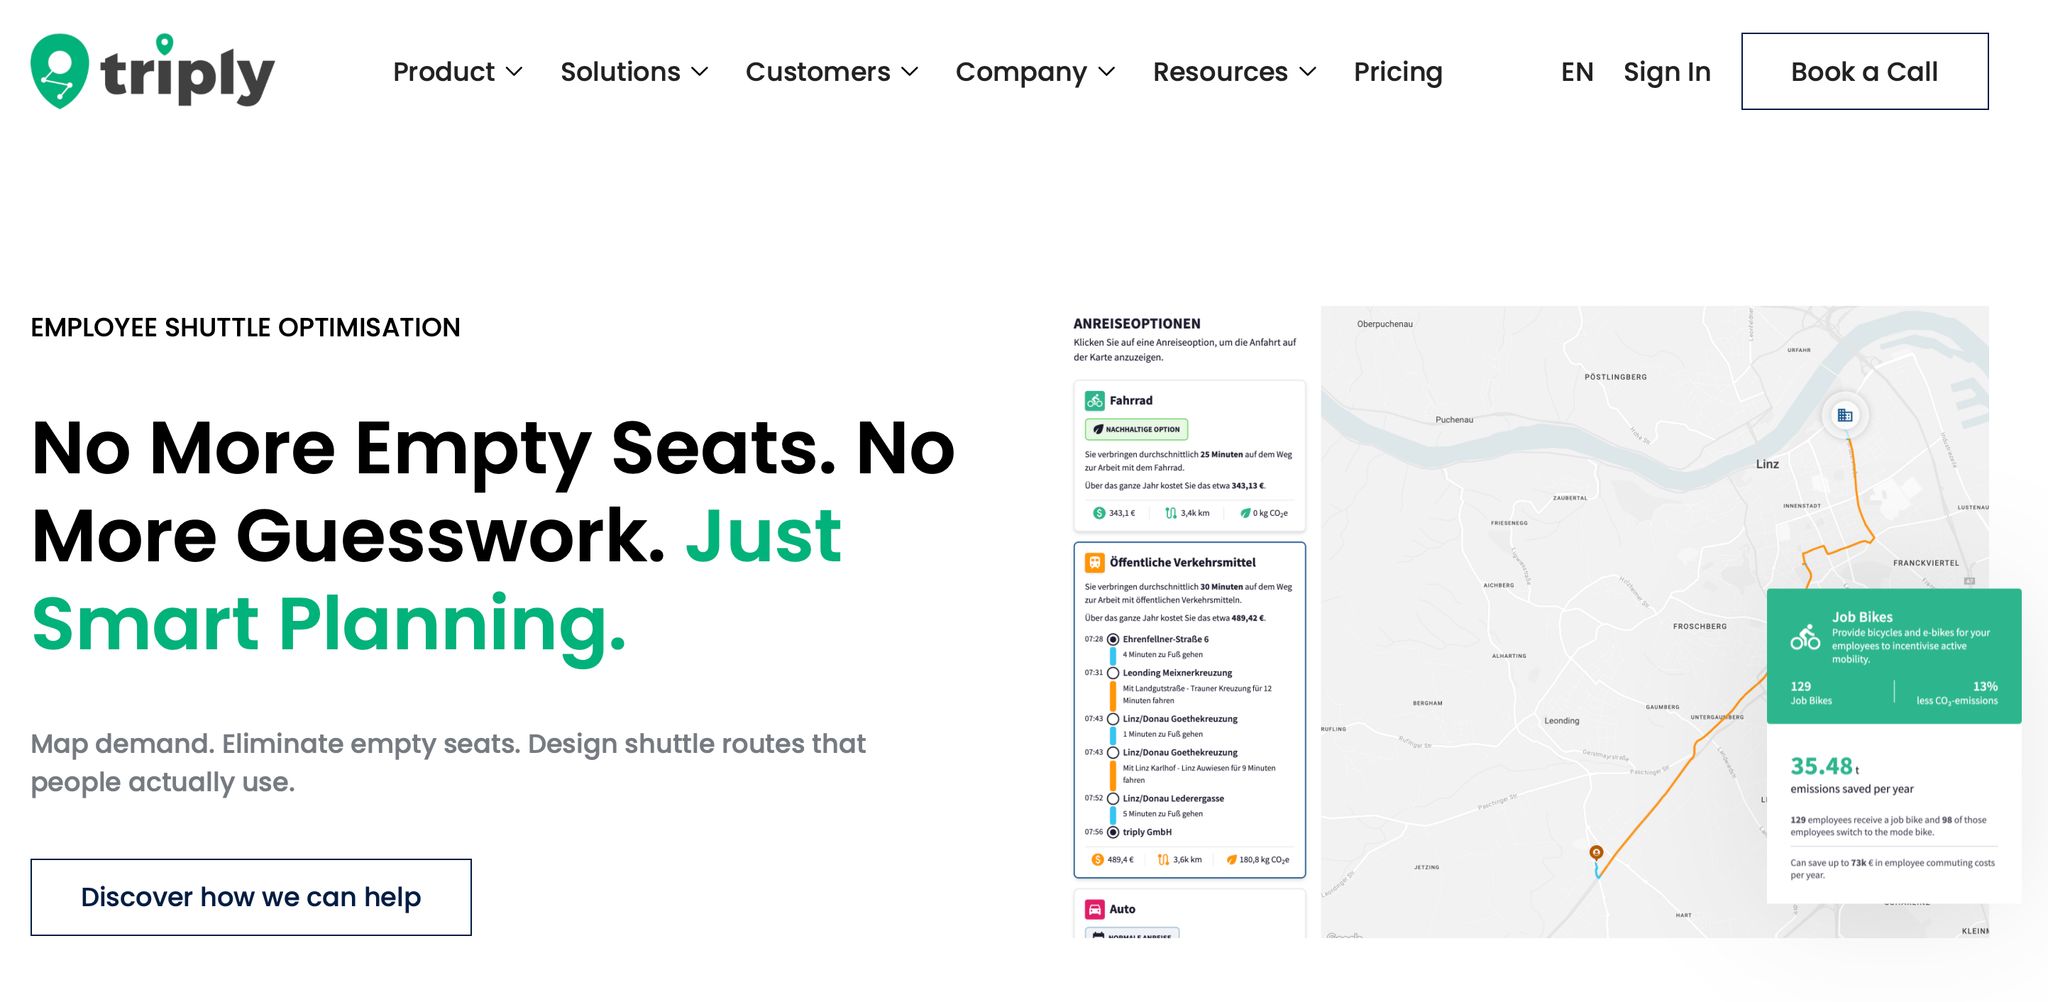
triply builds a commute model for each of your sites using core HR data: employee home postcodes and shift patterns. You can get started without running a full employee survey. The platform pulls home postcode data straight from your HRIS, which helps cut the gaps that often show up in self-reported responses [2].
Once that origin data is mapped, triply layers in your shift schedules to show which commute corridors have enough demand for a fixed route and which are too spread out for that setup. That starting point then feeds route design, subsidy planning, and site-by-site comparison. If you operate more than one site, they all roll up into one site-level commute view.
triply lets you test shuttle route changes, public transport subsidies, carpooling programmes, and schedule adjustments side by side. Each simulation gives you three outputs: expected employee uptake, cost per boarded rider, and estimated Scope 3 Category 7 emissions reduction [2]. That means your operations, finance, and sustainability teams can work from the same data set instead of arguing from separate spreadsheets. It also keeps a per-rider distance ledger for distance-based Scope 3 Category 7 calculations [2].
Shuttle programmes are a common use case. For shuttle programmes, see the employee shuttle optimisation page.
Once you can model and compare options, the next step is to test your own site data. Book a demo with triply to model your current commute picture and test one or two candidate measures.
Start by building a data base that shows how your people travel and where the main pain points sit. An employee survey can track travel modes, commuting distances, and frequency.
That baseline helps you move past rough guesses and use accurate distance-based calculations to track Scope 3 Category 7 emissions. This information is general and does not constitute legal or tax advice.
Start with high-impact, easy-to-roll-out measures: flexible work models, support for active travel, public transport incentives, carpooling, and a mobility budget.
Before you roll any of this out, look at how people already commute. That gives you a baseline and helps you see which measures are most likely to pay off at your site.
This is general information, not legal or tax advice.
Showing ROI before you commit budget takes the guesswork out of the decision. It gives you a data-based picture of current commuting habits, fleet usage, and the costs tied to both.
From there, you can estimate the likely financial and environmental impact of steps like public transport or cycling incentives before you roll them out. That makes it much easier to build a fact-based case for possible savings.
This is general information, not legal or tax advice.



