
Pick commute measures using site-level data and simulate uptake to cut parking, costs, and Scope 3 emissions.

If you want to cut commuting cost, parking pressure, and Scope 3 Category 7 emissions, start with site data - not with perks.
We’d boil the article down to this:
A few points stand out. A shuttle can work well when staff come from the same areas and start at similar times. Public transport support tends to help when the network already fits the commute. Carpooling often depends on shared routes and matching shifts. And active commuting usually needs short distances plus basics like secure bike parking, showers, and changing rooms.
Here’s the short version: don’t choose a measure because it sounds good - choose it because your site data says people will use it. In many cases, even a small shift in mode share can ease parking demand by 10-20% at a busy site, while weak-fit measures can cost €0 in parking relief despite budget spend. That’s why you should model likely uptake first and buy later.
| Measure | Best fit | Main risk | What to check first |
|---|---|---|---|
| Public transport support | Good existing network | Weak links and poor shift fit | Route quality and timing |
| Shuttle | Clustered origins and shift teams | Low load factor | Demand density |
| Carpooling | Shared routes and similar hours | Hard to match riders | Shift overlap |
| Active commuting | Short distances and site facilities | Poor access or no facilities | Safe routes and on-site setup |
That is the core point of the article: use a site baseline, compare options on the same metrics, and fund the measure that fits each site best.
A baseline turns current commute patterns into evidence you can use to pick measures with a better chance of working.
Generic measures often fall flat because they ignore how people at a given site actually commute. The result? Budget gets spent, but behaviour barely changes.
The main problem is a lack of site-level data. If you don't know where employees live, when they need to arrive and leave, or which travel modes are even realistic for that site, you're guessing. And guesswork gets expensive fast.
A measure that works at one site can do very little at another. Why? Because commute geography, shift setup, site access limits, and public transport links can vary a lot from place to place. Before choosing any measure, you need to map those differences.
A useful baseline brings together the data that matter for each site.
Start with employee home locations at PLZ level to spot origin clusters. Then pair that with shift schedules and arrival and departure windows. That helps you see which modes are realistic for each workforce group.
It also helps to include:
Taken together, these inputs show where the current system is under pressure and where behaviour might shift.
You don't need a huge data model. You just need enough structured data to separate likely wins from measures that won't change much. That baseline then becomes the basis for comparing measures by site, shift pattern, and expected uptake. With it, you can check fit first and spend later.
The best measures line up with how people actually get to work: their commute pattern, shift setup, and how easy the site is to reach. That’s what tends to move mode share, parking demand, and Scope 3 Category 7.
Start with your baseline. It gives you a way to compare likely uptake before you put money on the table. From there, test each option against three simple checks: likely uptake, load factor, and cost per boarded rider.
Public transport incentives can help if the network already gives employees a practical route to the site. In that case, lower ticket costs or employer support can nudge more people onto buses, trams, or trains.
But there’s a catch. If the connection is weak, incentives on their own usually don’t move behaviour much. A cheaper ticket doesn’t fix a long walk, awkward interchange, or a service that doesn’t match shift times.
Shuttles make sense when public transport links fall short and employee travel patterns are easier to group. They tend to work best when people start from similar areas and travel at similar times.
That’s why shuttles often fit sites with shift work or clear origin clusters. The main test is simple: is demand dense enough to keep a steady load factor? If not, the service can look good on paper but struggle in day-to-day use.
Carpooling and active commuting usually work best as targeted measures, not one-size-fits-all fixes. They suit the groups they suit.
Carpooling can help where staff live along similar routes or have matching shift times. Active commuting depends more on safe routes, distance, and site facilities such as bike parking, showers, or changing rooms.
These are the measures worth testing in scenario modelling.
Once you have a baseline and a shortlist, the next step is simple: compare every option against the same baseline before you spend any money.
That’s the job of pre-investment simulation. It helps you test whether a shuttle, a public transport incentive, or a carpooling programme is likely to work at your sites, based on shift patterns and where employees live.
Look at the same set of metrics in every scenario: expected uptake, load factor, cost per boarded rider, total cost, parking relief, and Scope 3 Category 7 impact. When each option goes through the same decision lens, it becomes much easier to compare like with like before procurement.
| Scenario | Expected uptake | Load factor | Cost per boarded rider | Parking relief | Scope 3 Category 7 impact |
|---|---|---|---|---|---|
| Current state (no new measure) | Baseline | Baseline | Baseline | Baseline | Baseline |
| Public transport incentive | Low to moderate, depending on site context | Variable | Variable | Low | Moderate if modal shift occurs |
| New shuttle route | Moderate to high where origin clusters exist | Variable | Variable | Moderate to high | High if cars are displaced |
| Carpooling programme | Low to moderate, shift-dependent | Variable | Variable | Low to moderate | Low to moderate |
Using the same metrics for every option keeps the decision tied to comparable evidence, not guesswork.
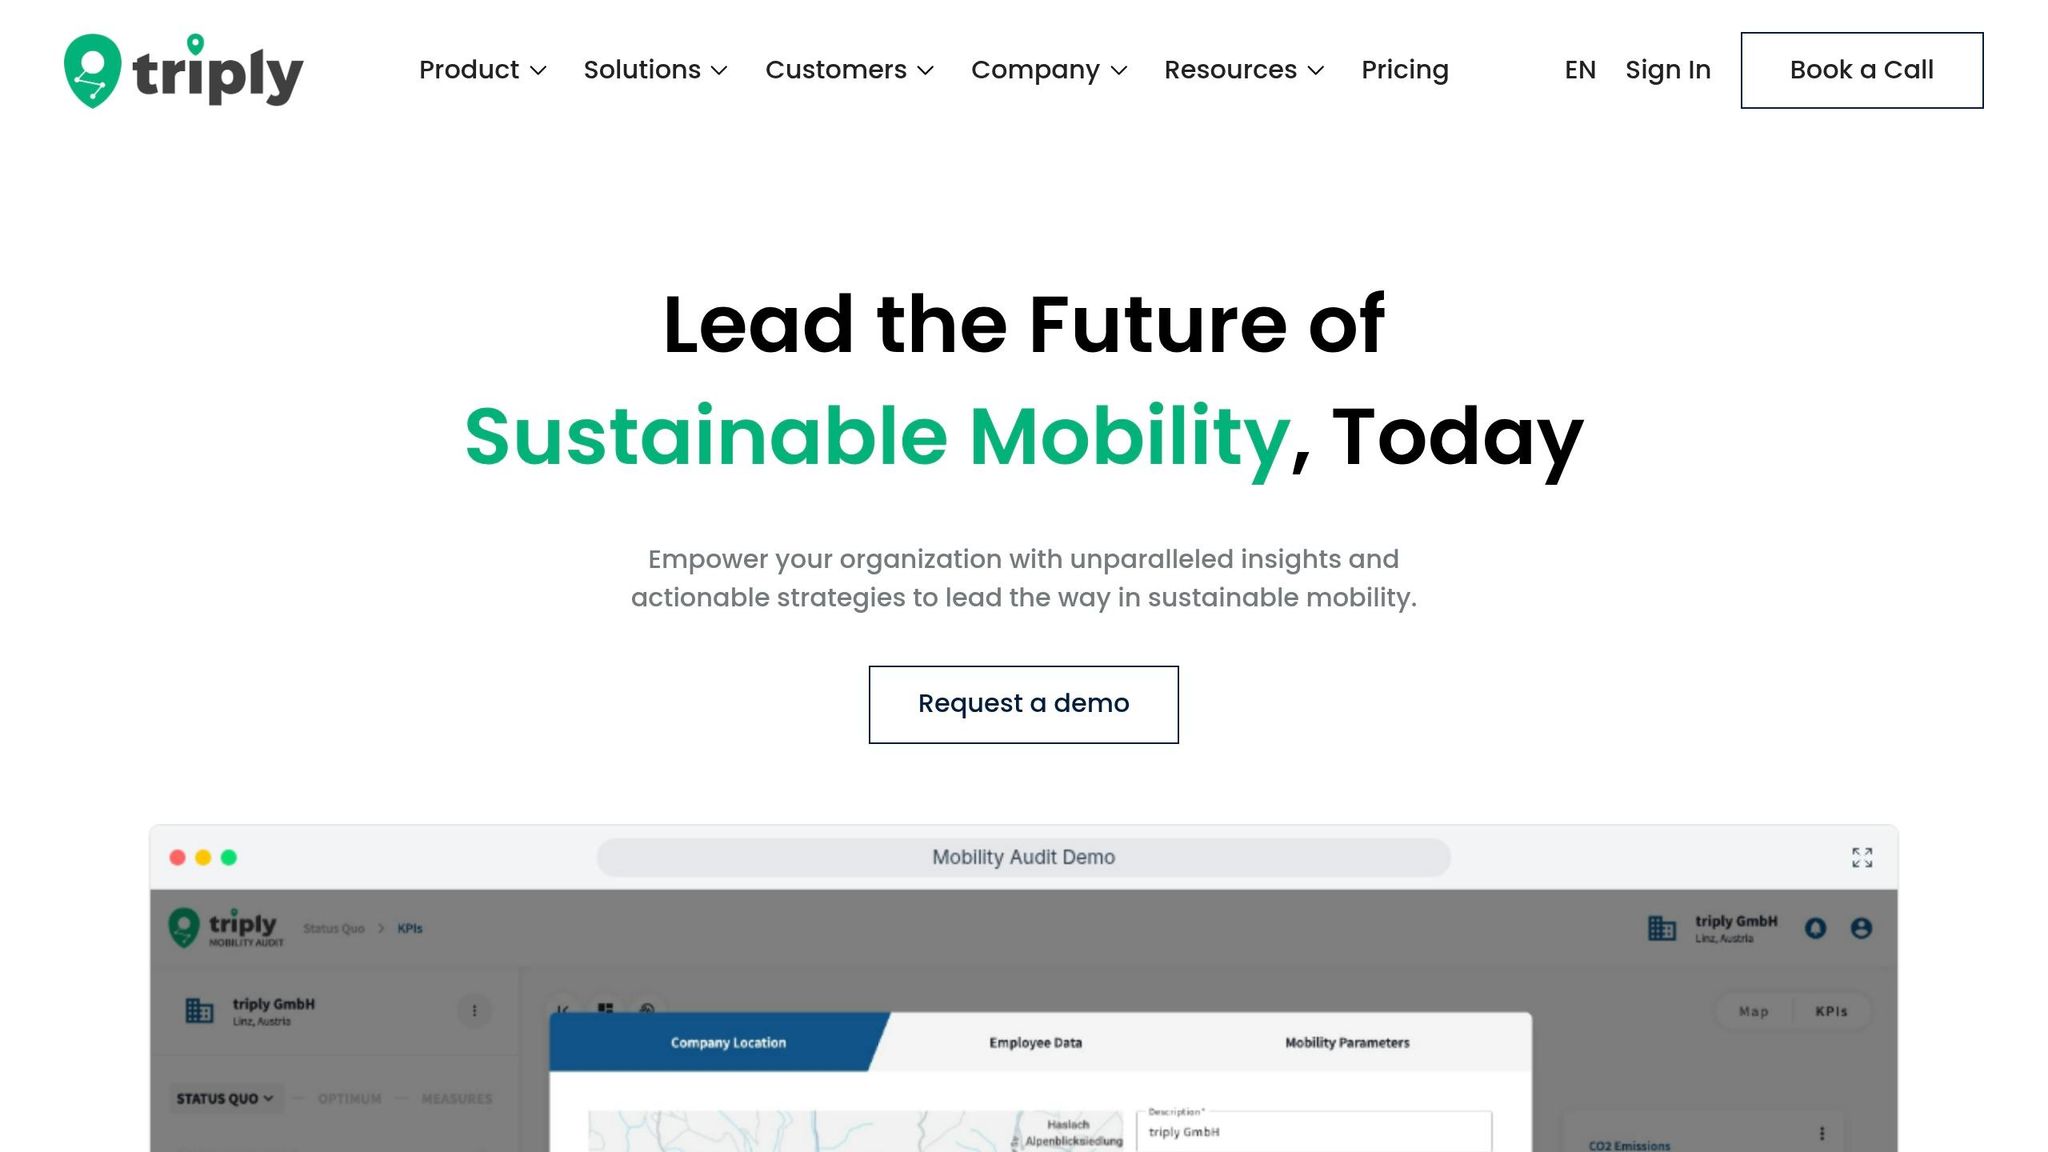
triply models employee commutes using postal codes and shift patterns, without needing to survey the full workforce. That gives you one consistent commute picture across multiple sites, which helps when finance, sustainability, and operations all need to work from the same data set.
From that baseline, you can simulate specific measures, including shuttle routes, public transport incentives, carpooling options, or schedule changes. Each simulation shows expected uptake, load factor, cost per boarded rider, total cost, parking relief, and Scope 3 Category 7 impact before any procurement decision is made.
At this stage, you’re answering one practical question first: which measure is worth funding at this site, for this workforce, and on these shifts?
After looking at different scenarios, the choice comes down to fit at each site. The measures that change behaviour are the ones that line up with how people already commute, because what works well at one location may have little effect at another. That’s why it makes sense to model before you invest: it shows whether a measure suits the site, workforce, and budget.
That same evidence also makes internal alignment easier. A shared commute evidence base helps mobility, operations, sustainability, HR, and finance agree faster on priorities and budgets.
The next step is to test the options against your own sites. With triply, you can build that evidence base from postal codes and shift patterns, model commutes across your sites, and simulate specific measures before procurement. Book a demo to test your current commute baseline and scenario options before rollout.



