
One shared commute model aligns finance and sustainability to judge shuttle ROI, load factor and Scope 3 Category 7 cuts in one view.

If finance and sustainability use different commute assumptions, shuttle decisions slow down and ROI gets harder to judge. Fix that with one shared commute model that shows both annual shuttle cost and Scope 3 Category 7 cuts at the same time.
Here’s the article in plain terms:
That matters because a shuttle can look good in one spreadsheet and weak in another. If the ridership, occupancy, or commute mix changes between teams, the answer changes too.
Keep the model tied to a small set of inputs:
From there, calculate two things from the same base:
The article’s main point is simple: one baseline, one model, one approval view. That gives you a cleaner way to compare whether a shuttle is worth € spend, how many tonnes of CO2e it cuts, and whether the €/tCO2e result makes sense for your site.
A useful detail from the piece: a negative marginal abatement cost means the shuttle cuts emissions and saves money. A positive one means you pay for each tonne avoided.
| What to align | Why it matters |
|---|---|
| Baseline commute data | Stops finance and sustainability from using different numbers |
| Site and shift patterns | Early and late shifts change ridership and route use |
| Mode-specific emissions factors | Keeps Category 7 reporting consistent |
| Route and vehicle inputs | Keeps cost and emissions tied to the same scenario |
| One decision table | Lets both teams review the same case in one meeting |
So if we were preparing an internal review in Germany on 28.07.2026, we’d want one table that puts € annual net cost or saving, tCO2e avoided, load factor, and cost per rider side by side. That’s the shortest path to a clear yes, no, or revise decision.
Before you model any shuttle setup, lock in one shared baseline that both teams accept. That means the same inputs, the same assumptions, and the same source data. If finance is working from one set of numbers and sustainability from another, things go sideways fast.
Start with the minimum data for each site and shift.
You need employee home PLZ (postal codes), the worksite location, and attendance patterns split by site and shift. Shift timing matters. A shuttle for an early-morning shift will not behave the same way as one built for standard office hours.
You also need commute mode data by site and shift. That includes private car, cycling, walking, and public transport, split by type. In Germany, make clear distinctions between ÖPNV (public transport), S-Bahn (urban rail), U-Bahn (urban metro rail), and Regionalbahn (regional rail). If you already have employer-side cost records, bring those in too.
Turn those commute patterns into a Scope 3 Category 7 baseline by multiplying annual commuting distance by the matching emission factor for each mode, then adding the totals across employees. The result is your baseline Scope 3 Category 7 figure in tonnes of CO2 equivalent.
Use one agreed factor set, and document both the factor set and its update date. That way, the baseline is auditable and both teams can trace how the figure was built.
The same commute data should also anchor the financial baseline. Start with direct employer costs from existing records. Then add any other commute-related employer costs you can support with clear evidence.
Later, that baseline will let you compare shuttle cost, load factor, cost per boarded rider, and ROI against the same starting point. In Step 2, you’ll use those reference points to test shuttle scenarios on like-for-like terms.
Run each shuttle scenario against the same baseline. Change only the route, vehicle, and timetable assumptions. That way, finance and sustainability are looking at the same scenario, not two different versions of the truth.
For each scenario, return four outputs:
Map out the route geometry, stop pattern, departure times, vehicle capacity, service frequency, and any empty running.
This part matters more than it may seem. A shuttle can look good on paper, then drift off course once deadhead kilometres, low-use stops, or awkward departure times show up. The aim here is simple: set one clear operating pattern for each scenario so the maths stays consistent.
Work out total annual shuttle cost using vehicle, driver, energy, maintenance, and administration costs. Then divide by boarded riders to get cost per boarded rider. Divide by seat capacity to get load factor.
In plain terms, this tells you two things at once: what the shuttle costs to run over a year, and how well those seats are being used. A half-empty shuttle may still cut emissions, but the cost picture can change fast.
Subtract avoided commuter emissions from the baseline and add shuttle emissions to produce the new Scope 3 Category 7 total.
Those figures then become the input for ROI and marginal abatement cost in Step 3[1][2].
Those scenario outputs feed the ROI and marginal abatement cost view in Step 3.
Now take the Step 2 outputs and turn them into numbers that both finance and sustainability can use in the same approval view.
Use the same scenario outputs to work out the financial return. Calculate ROI with this formula: (annual savings minus annual shuttle cost) / (annual shuttle cost)
Only count verified site-level savings in the calculation. That means savings you can back up, such as:
If a saving has not been verified yet, don’t mix it into the core ROI. Keep it qualitative or label it clearly as illustrative. That keeps the model clean and avoids debates later.
Emissions avoided are simple to calculate: baseline Scope 3 Category 7 minus the shuttle scenario result, in tCO2e
Marginal abatement cost (MAC) brings the money view and the emissions view together. It shows the net cost or saving for each tonne of CO2e avoided.
A negative MAC means the shuttle lowers emissions and saves money. That’s the kind of result people love to see.
A positive MAC means you are paying to cut each tonne. That can still make sense if the business case holds up.
Put ROI and Scope 3 Category 7 next to each other so finance and sustainability are looking at the same scenario, at the same time. Use this table for internal review. Fill it with site data where you have it. If you’re still early, mark the numbers as illustrative.
The point is simple: one model, one set of assumptions, one approval view.
| Metric | Baseline | Shuttle Scenario A | Shuttle Scenario B |
|---|---|---|---|
| Annual net cost or saving (€) | Reference point | Illustrative | Illustrative |
| Scope 3 Category 7 (tCO2e) | Baseline | Scenario total | Scenario total |
| Emissions avoided (tCO2e) | N/A | Baseline minus scenario | Baseline minus scenario |
| Marginal abatement cost (€/tCO2e) | N/A | Positive or negative | Positive or negative |
| Load factor | N/A | % of seat capacity used | % of seat capacity used |
| Cost per boarded rider (€) | N/A | Annual cost divided by boarded riders | Annual cost divided by boarded riders |
Use one table to keep finance and sustainability aligned in the same meeting.
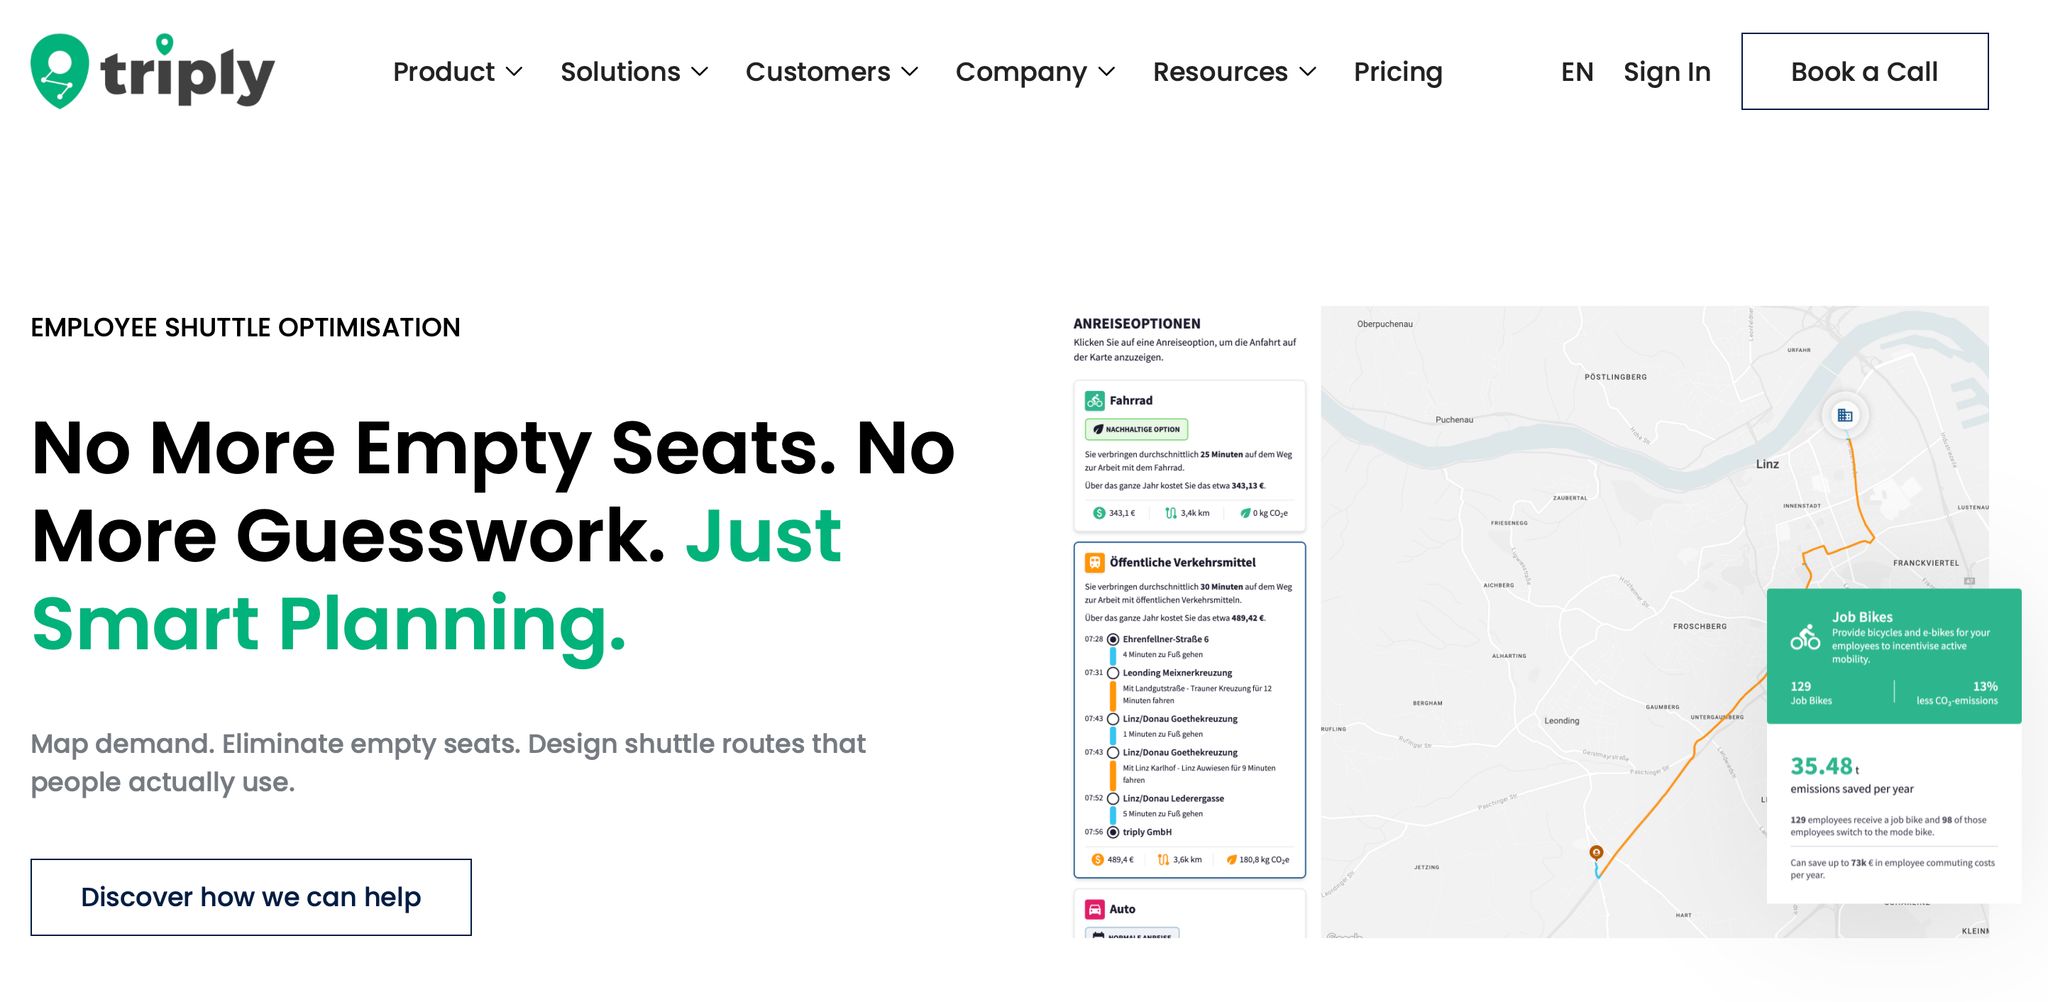
This guide comes down to one simple idea: one baseline, one model, one approval view. When finance and sustainability work from the same numbers, shuttle decisions move faster and are much easier to sign off. That’s the same approach triply uses to test shuttle scenarios before any budget is locked in.
Start with one shared baseline. Then use one model to calculate ROI and Scope 3 Category 7 at the same time. When you test shuttle scenarios, outputs like cost per boarded rider, load factor, and emissions avoided should all come from the same set of assumptions.
Why does that matter? Because it cuts out the back-and-forth. No reconciling two separate decks. No arguing over which team has the right numbers. Use the Step 3 decision table to compare ROI and Scope 3 Category 7 side by side.
If you want to apply that decision table to your own sites, triply models employee commutes from minimal data, lets you test shuttle routes, vehicle sizes, and timetables, and turns that same model into audit-ready Scope 3 Category 7 output for reporting. Finance, sustainability, and operations work from one shared evidence base.
If you want to see how your site data translates into shuttle ROI and Category 7 reduction in a single model, book a demo with triply. Test the scenarios before you commit budget.



