
Mexican plant commutes must be included in group Scope 3 Category 7 using one standard method and four local inputs.
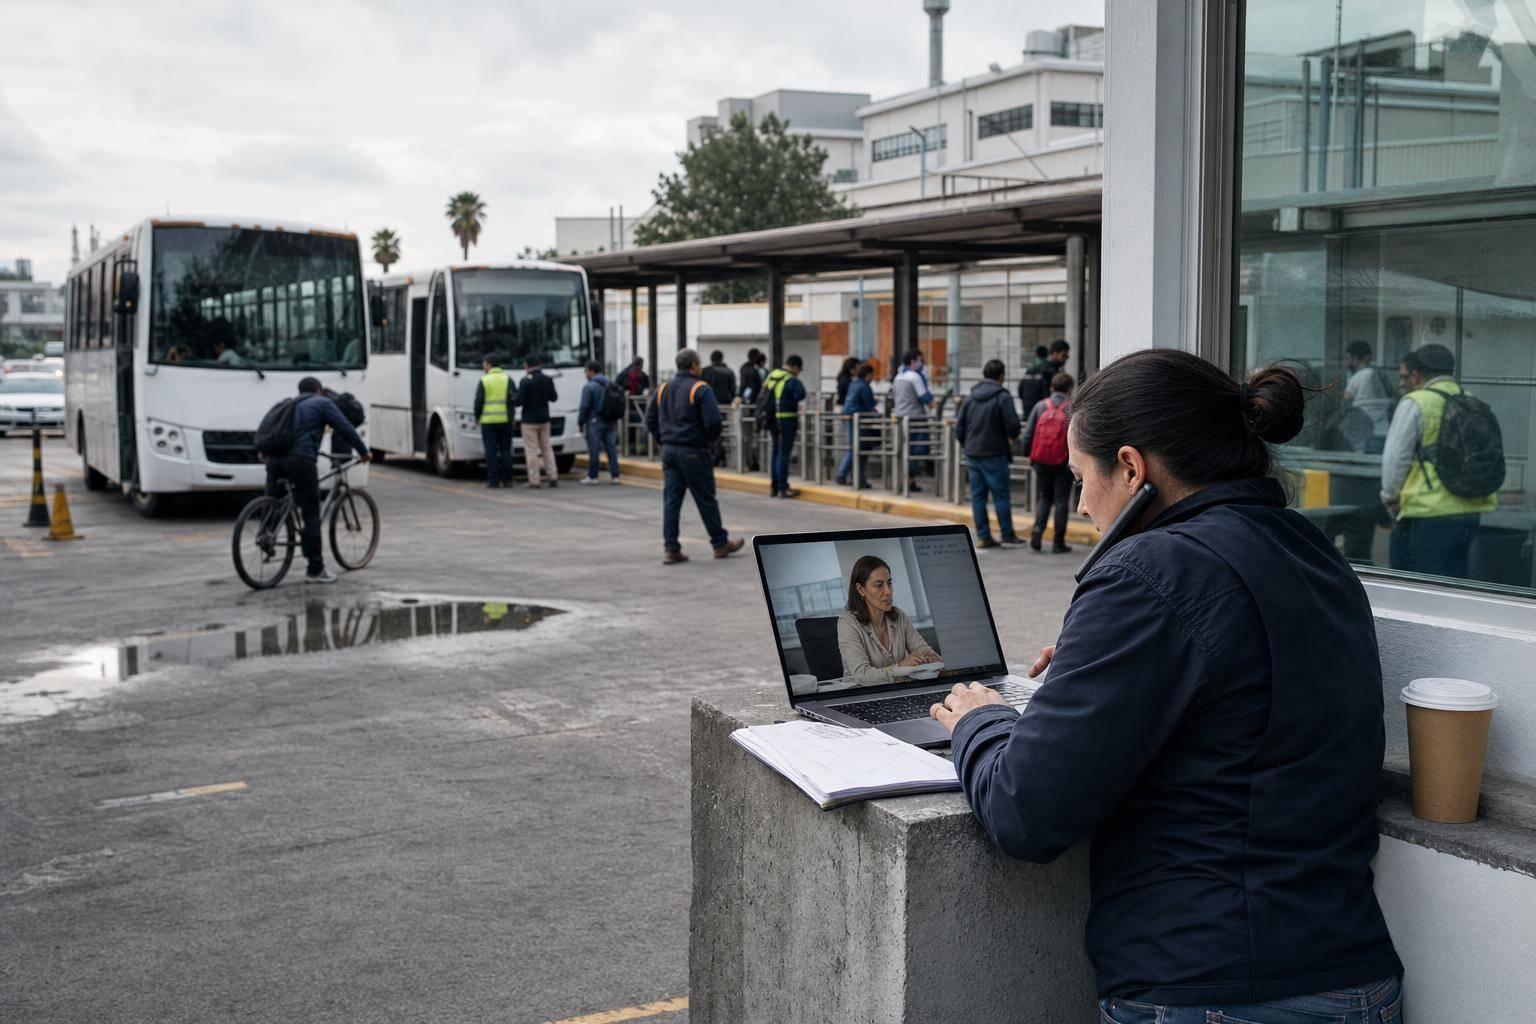
If your EU group includes a plant in Mexico, you should include its employee commute emissions in Scope 3 Category 7. You should not leave the site out just because local data is uneven. The fix is simple: use one group calculation approach, collect four core data points, and log what is site data versus modelled data.
Here’s the short version:
A few facts matter here. In manufacturing, shift rotation can change trip counts a lot. And if several plants use different surveys, assumptions, or spreadsheets, the group report becomes hard to check.
| Point | What to do |
|---|---|
| Reporting boundary | Include all Mexican plants inside group consolidation or control boundary |
| Category | Report under Scope 3 Category 7 |
| Data issue | Fix gaps from split records across HR, finance, and site teams |
| Core inputs | Use 4 baseline inputs for every plant |
| Group rule | Keep 1 calculation approach across all sites |
| Review trail | Tag each input as source-based or modelled |
So, if we had to put it in one line: don’t wait for perfect plant data - set one group rule, use local inputs, and build a repeatable reporting process before the next cycle.
Mexican plants often run rotating shifts. That makes commute modelling harder to standardise.
If a site runs several shift patterns, commute trips need to be mapped for each rotation separately. That changes how you count worker movements and how you group them into a baseline you can defend in reporting. Put simply: the shift setup shapes how commute trips are mapped at each site.
The main issue is split ownership.
HR holds employee addresses. Operations holds shift schedules. Finance holds transport provider invoices. When those inputs sit in different teams, sites often end up working from mismatched records.
And the issue isn’t just the amount of data. It’s the fact that source data is collected in different ways across functions and across plants. That can include:
When each location handles those inputs a bit differently, the result is uneven reporting from site to site.
When each site uses different surveys and different assumptions, group reporting gets harder to compare and harder to defend. It becomes less clear whether sites are measuring the same thing in the same way.
To make the roll-up defensible, you need one calculation method and one set of local inputs. From there, the next step is to turn those inputs into one documented baseline.
For an EU-headquartered group, use one documented Scope 3 Category 7 method across every Mexican plant. Then change only the local inputs from site to site. Once that method is locked, the next job is simple: decide the minimum data each plant needs.
Use the same calculation method for every plant and write down the assumptions in plain terms. That includes emission factors, how you treat hybrid work, and the load factor for shared transport. When the method stays the same, baselines are much easier to compare across sites and much easier to audit.
You don’t need a huge data collection exercise to build a first baseline that stands up to review. Four core inputs are enough:
Together, these inputs support your distance, frequency, and annual baseline estimates. They also give you a setup you can repeat in each reporting cycle without rebuilding the whole model from scratch.
Keep the methodology fixed across sites and change only the local inputs.
Use local Mexican parameters for transport modes, distances, occupancy assumptions, and emission factors, but keep them inside the same group-wide reporting structure you use elsewhere. To preserve auditability, use traceable one-to-one mapping so every relationship between a local input and a reported emission is explicitly explained [1]. Tag each data point in the commute baseline so reviewers can see what comes straight from site records and what has been modelled or inferred.
That tagged baseline then feeds into triply's modelling and reporting workflow.
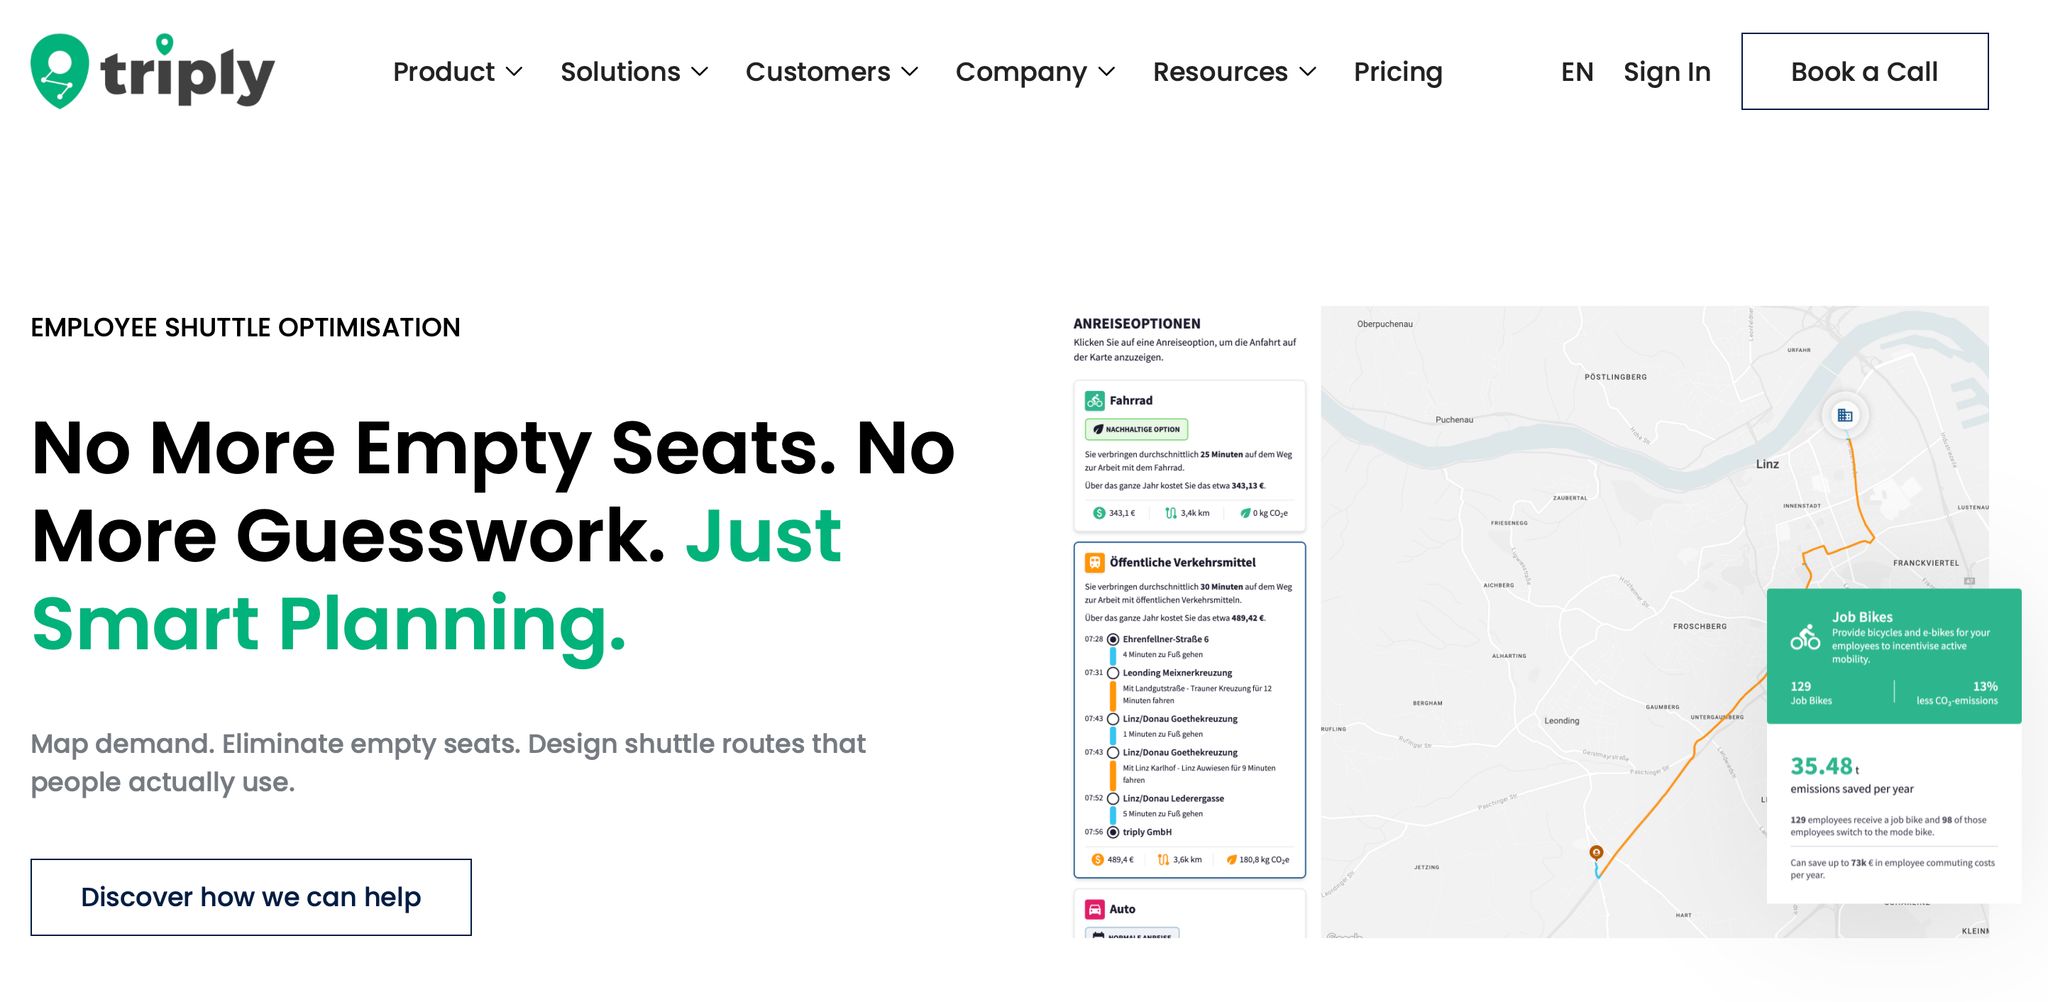
Once your baseline is set, triply turns it into a reporting workflow your whole group can use in each cycle.
triply builds a commute model from site data you already have, like location and shift patterns. You don't need a large employee survey to get started.
The result is a group-ready baseline for both EU and Mexican plants. Mobility, sustainability, operations, and finance all work from the same dataset, so you avoid version drift between sites. If reviewers ask how the Mexican figures were derived, you can trace each figure back to the documented method and local inputs.
That baseline then becomes the input for simulation before you commit budget.
With the baseline in place, you can test local transport measures before rollout. triply lets you run a simulation of the likely effect on uptake, cost, and Scope 3 Category 7 emissions before you spend any budget.
You can compare options like a shuttle, carpool, schedule change, or subsidy before making a call. The simulation gives you a direct view of projected outcomes, so decisions rest on evidence instead of assumption. Any figures produced at this stage are clearly marked as modelled estimates.
Manual spreadsheets tend to drift across sites and reporting cycles. triply keeps assumptions, inputs, and outputs in one documented workflow with a traceable audit trail. Every input is recorded, and the output maps directly to Scope 3 Category 7 under CSRD and ESRS E1.
That gives your group one repeatable process for each reporting cycle.
Commuting from your Mexican plants should sit inside your group Scope 3 Category 7 boundary. If your EU headquarters reports under CSRD, those sites need to be part of the group roll-up. When each plant uses its own rough estimate, you create audit and governance risk. The fix is simple in principle: use one documented calculation method across every plant, and turn it into a short process your team can run again next cycle.
Before the next reporting cycle starts, put a few concrete pieces in place.
Define the calculation method first. Pick one method, write down every assumption, and set it as the group standard. Local Mexican inputs should fit inside that model, not sit beside it.
Gather minimal site data. Postal codes, headcount, and shift patterns are enough to build a baseline you can stand behind. Give data collection a clear owner so it doesn't get stuck at plant level.
Align local and group assumptions. Audit risk shows up when plant-level assumptions don't match group consolidation rules. Agree on the method and the assumptions before the cycle begins, not after.
Once the method and inputs are set, the workflow becomes repeatable across sites. With triply, you can build the baseline from minimal data, test measures before budget is committed, and produce audit-ready Scope 3 Category 7 reporting under CSRD and ESRS E1. If you want to see how that works for your sites, book a demo with triply.
This article provides general information only. It is not legal, tax, or accounting advice. Consult qualified advisers for guidance specific to your organisation's situation.



