
Map commute patterns and simulate shuttle, subsidy and schedule changes to cut commuting costs without harming retention or emissions reporting.

If you cut commute support without data, you can save money in the budget and lose more money in turnover. That is the core point.
Here is the short version:
A few facts make this urgent for large multi-site employers in Germany:
Your best next step is to map postal codes and shift patterns, find the highest-cost and highest-risk groups, and simulate changes before approving budget.
| What to check | Why it matters |
|---|---|
| Load factor | Shows if a shuttle or route is underused |
| Cost per boarded rider | Shows where spend is high per user |
| Travel time | Shows the strain employees feel |
| Access coverage | Shows who still has a workable way to get to work |
So the article’s message is not “cut less”. It is: cut with proof.
Before you cut anything, split employee burden from employer spend. They overlap, but they are not the same.
Commuting costs go far beyond fuel or train tickets. They can include parking, tolls, time lost in transit, subsidies, shuttle contracts, admin time, and even empty seats on employer-run shuttles. Those half-full buses may look fine on paper, but they still cost money.
Fuel prices can shift fast, and longer drives usually get hit first. That means the pain is often felt most by employees who already have the heaviest commute load.
Money is only one side of it. Time is the other.
A long, draining commute can chip away at attendance and day-to-day reliability well before it turns into a resignation. People do not always quit right away. First, they show up tired. Then they miss more often. Then the role starts to feel harder than it should.
Site-to-site differences can make this worse. If one location loses a commuting benefit and another keeps it, employees notice. And if there is no clear reason, the message is hard to miss: that site matters less.
That is why it helps to measure the full commute burden before cutting support. Looking at only one line item, like fuel or ticket spend, misses the part that employees feel most.

Scope 3 Category 7 relies on the same commute data. So if the data is weak, the emissions estimate will be weak too. And once that happens, cost decisions get shaky as well.
Finance, HR, and sustainability need one shared commute model before any policy changes happen. Without that, cuts are based on guesswork rather than a clear view of cost, employee strain, and emissions impact.
Reactive cuts can shrink spend on paper. But they often create bigger problems later.
If you cut the only workable commute option for part of your workforce, you may end up with higher retention risk, lower attendance, and more fairness risk. What looks like a simple budget fix can turn into a staffing problem.
| Reactive measure | Short-term cost effect | Retention risk | A better data-led option |
|---|---|---|---|
| Cut transport frequency or reduce stops | Reduces contract spend | High where employees have no viable alternative | Model load factor by route, then cut only underused runs |
| Remove or cap commuting support | Reduces subsidy budget | High where access coverage is weak | Check access coverage and travel time by site before changing support |
That’s why you need load factor, cost per boarded rider, travel time, and access coverage before you change anything.
Load factor and cost per boarded rider - the total route cost divided by the number of employees who use it - give finance a plain view of where spend is inefficient. They show which routes are doing their job and which ones are draining budget.
Travel time and access coverage tell a different part of the story. Access coverage means the share of employees with a viable commute option within an acceptable travel time. These metrics help HR and operations see where the burden sits and where a cut would remove a critical link.
A commute model lets you make that call before you spend. It keeps each route, stop, and dependency visible, so you can see who gets hit before you change service levels.
With those metrics in place, you can simulate specific commute changes before you invest.
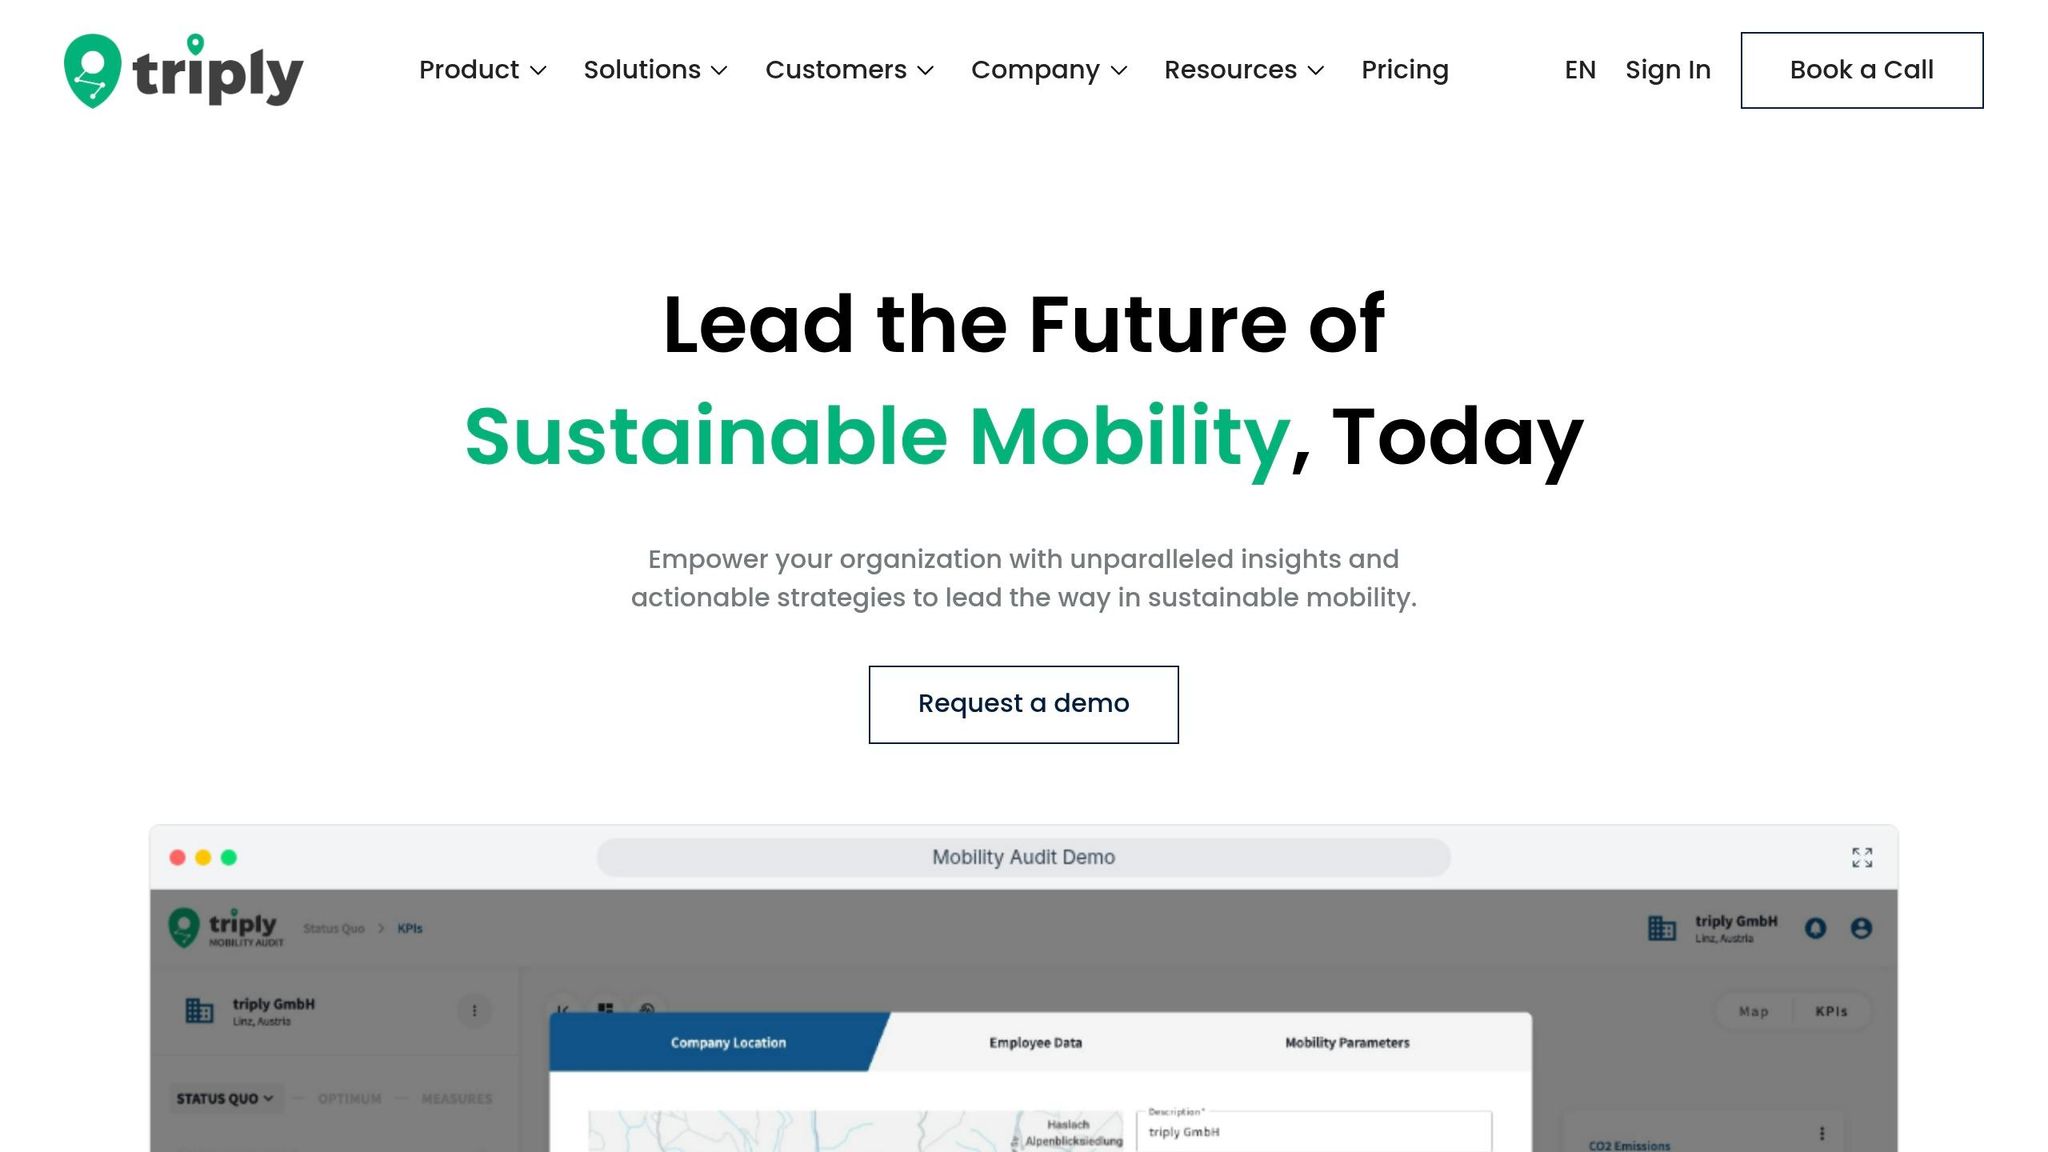
Once you have load factor, cost per boarded rider, travel time, and access coverage, you can test the next step before you spend money.
triply builds a commute model from two inputs most employers already have: employee postal codes and shift patterns. From there, it looks at commute patterns, combines data across multiple sites, tests measures before budget is approved, and produces audit-ready Scope 3 Category 7 data for CSRD and ESRS E1.
The table below lays out the main options and the trade-offs that come with each one.
| Measure type | Employer cost impact | Employee cost impact | Retention considerations | Scope 3 Category 7 effect |
|---|---|---|---|---|
| Public transport support | Ongoing subsidy cost; predictable and scalable | Reduces out-of-pocket travel spend | Positive where public transport coverage is strong | Reduces emissions where employees shift from car to rail or bus |
| Employee shuttle optimisation | Reduces cost per boarded rider when load factor improves | No direct employee cost | High risk if routes are cut without checking access coverage first | Lower per-trip emissions as vehicle occupancy rises |
| Carpooling support | Implementation effort varies by site and shift pattern | Reduces commuting cost for participants | Works best where shift times align across employees | Reduces single-occupancy car trips |
| Flexible scheduling | Minimal direct cost; operational complexity varies | Reduces peak-hour travel burden | Positive where employees value schedule control | Indirect effect; reduces congestion-related idling |
The key point is simple: the simulation puts cost, employee impact, and emissions in one view. That’s exactly where ad hoc decisions often fall apart. One team looks at budget, another looks at retention, and nobody sees the full picture until after the change is made.
This matters most for shuttle routes, because even small shifts in occupancy can change both cost and retention risk.
Shuttle services are often tough to fine-tune without solid data, and triply's employee shuttle optimisation analysis is built for that exact job.
Before you change a route or schedule, the simulation shows the projected load factor and cost per boarded rider for each scenario. It also shows the commute-time effect for every affected employee group. That makes it much easier to spot which runs are actually underused and which ones, even with low ridership, still serve employees who have no other workable option.
In plain terms, you can improve efficiency without cutting a route that people depend on to get to work.
Use these scenario results to guide the joint finance-and-HR decision. That gives both teams one shared basis for approval.
The right next step isn’t another policy cut. It’s a joint decision framework.
Finance is focused on lower commuting costs. HR is focused on protecting retention. The only way to serve both is to work from the same commute model. That means one shared data set across finance, HR, and sustainability, so cost, retention, and Scope 3 Category 7 decisions stay aligned.
Cost decisions need HR input. Retention decisions need cost data. And Scope 3 Category 7 should sit in that same view, so CSRD and ESRS E1 reporting is audit-ready.
Start by mapping current commute patterns. From there, pinpoint the sites and employee groups with the highest risk, then simulate shortlisted measures in triply before you commit budget.
When cost, retention risk, and emissions sit side by side, approval gets much easier. To see how this looks with your own sites, book an employee shuttle optimisation demo and review a commute model built from your own data.
You can cut commuting costs without pushing up turnover if you model commute patterns before you make changes. That gives you a clearer view of which measures may lower spend while helping you keep people, instead of treating finance and HR goals like they’re pulling in opposite directions.
triply’s approach centres on pre-investment commute modelling and measure simulation, so you can test options before rollout.
To model commuting risk, you need the right commuting data for your workforce and sites. The exact inputs depend on the model you use and the measures you want to test.
Start with measures you can model before rollout, so you can estimate cost and retention impact in advance. The aim is simple: cut commuting spend without making the trip meaningfully worse for employees.
In practice, that means looking at the likely effect on travel time, access, and rider coverage before you change support, routes, or schedules. This is general information, not legal or tax advice.



