
Treat all plants as one shuttle network: map origins, align with badge-in deadlines, build trunk-and-branch routes, and track shared KPIs.

If you run shuttles for more than one plant, planning each site on its own usually wastes seats, adds empty kilometres, and makes reporting messy. All plants should be treated as one network: map the same home postcodes, line up routes with each shift wave, plan to the badge-in deadline rather than the shift start, and track the same numbers across every site.
In simple terms, this article says one thing: one commute model beats separate plant plans. That helps you spot shared corridors, merge duplicate runs, time arrivals to the right gate, and compare plants using the same measures like load factor, cost per boarded rider, empty-run rate, and Scope 3 Category 7 emissions.
Here’s the short version:
A simple example: if two plants pull workers from the same area and send separate buses at nearly the same time, both vehicles may run half full. A shared route can cut that overlap and lower the cost per rider.
| Approach | How it works | Main issue or gain |
|---|---|---|
| Site-by-site planning | Each plant builds its own shuttle plan | Duplicate routes, lower seat use, harder cross-site reporting |
| Coordinated network planning | All plants use one commute model and one KPI set | Better route matching, fewer empty runs, simpler cross-site decisions |
If we were setting this up, we’d first build the network view, then test routes, shift timing, gate access, and rail links on top of that base.
In a manufacturing setup, company shuttle transportation isn’t just a staff perk. It’s part of the production plan. If a shift starts at 06:00, the shuttle must get employees to the right gate early enough to pass security and walk to their station. Reaching the edge of the site isn’t enough [2][3].
For a multi-site employer, the planning scope is broad. It usually includes inbound commuter routes from spread-out residential postcodes, last-mile links from rail or bus stops where public transport (ÖPNV, local and regional transit) doesn’t reach the industrial area, park-and-ride feeders from outside collection points, and inter-plant trips for technicians, supervisors, and support staff moving between sites during the day. Before approving a route, use pre-investment commute modelling to test all of these flows across all sites. In practice, that means modelling two connected flow types together: plant access shuttles and inter-plant movements.
Most multi-site employers begin with plant access shuttles. These routes bring employees from home or from a collection point to a specific gate in time for shift handover [3]. Inter-plant trips for technicians, supervisors, and support staff are often left unplanned or handled on the fly.
That’s a missed chance. Both flow types often use the same corridors and fall into the same time windows. When you map them in one commute model, you can see where a single route may serve both jobs. In Germany, that often means planning beyond the city boundary and around shift timing.
German industrial sites are often outside city centres, in peripheral areas where ÖPNV coverage drops off sharply after the morning peak. The gap is even tougher for night-shift workers. Regional rail (Regionalbahn) and suburban rail (S-Bahn) often do not run in the early morning hours, which makes employer-run shuttles the only dependable option in that window [3].
These plant locations also create large catchment areas. So route design has to account for several pickup corridors and vehicle sizing by shift [3]. And roads are only part of the story. Sites with multiple gates and security checkpoints need gate-level arrival planning, not just site-boundary timing, because the gate check and the walk to the workstation are part of the work schedule [2].
This is general information, not legal or tax advice.
With one commute model in place, the next move is to look at where plants share demand and capacity. A coordinated network helps you cut duplicate routes, trim empty runs, and work from one set of metrics across all plants.
Many plants draw workers from the same residential postcodes. That means one network can pool demand into shared trunk corridors, then split into branch legs for each plant gate near the end of the corridor.
This cuts empty runs directly. These are the unproductive kilometres a vehicle drives with no passengers on board. If you line up layovers with the next shift wave, you can reduce deadhead kilometres and improve load factor across the network [2].
Use one metric set across finance, operations, and sustainability. Once routes are combined, the same network view should drive reporting too.
| Metric | What it measures | Why cross-site consistency matters |
|---|---|---|
| Load factor | Seats filled as a share of total seats per trip | Shows which routes are over- or under-served across the whole network |
| Cost per boarded rider | Total operating cost divided by actual riders | Lets you compare plants and corridors on a like-for-like basis |
| Scope 3 Category 7 emissions | Employee commuting emissions | Supports defensible, audit-ready reporting for CSRD |
| Empty-run rate | Share of kilometres driven without passengers | Tracks fleet efficiency across the whole network, not just one gate |
A shared baseline makes cross-functional decisions faster and easier to audit.
The most common mistake in multi-site planning is to treat each plant as its own problem, then try to fix routes locally. On paper, that can look fine. In practice, it often backfires.
A route change that improves load factor at one site can push departure times earlier across the network. Then riders miss connections from regional rail at a shared interchange and get stranded.
It makes more sense to optimise across the full network. Match overlapping departure waves across gates and shifts, use shared branch legs to remove duplicate routes, and place layovers where one plant’s schedule can absorb another plant’s vehicle.
Once you know where demand overlaps, you can build one commute model for all plants.
Turn those overlap patterns into one planning model that works across sites.
Build the model from four input groups.
| Input category | Specific data points | Purpose in model |
|---|---|---|
| Employee data | Anonymised postal codes (PLZ, Postleitzahl), current commute mode | Identify origin clusters and modal shift potential |
| Operational data | Shift rosters, shift start and end times, badge-in deadlines, planned headcount by line or department | Align shuttle arrivals with production handovers and capacity needs |
| Site data | Gates, security bottlenecks, geofenced loading zones, walking times to workstations | Model realistic arrival windows |
| Current patterns | Badge-in baselines, historical boardings, parking utilisation | Establish a demand and Scope 3 Category 7 emissions baseline |
The key point is simple: plan against badge-in deadlines, not shift start times.
That sounds like a small detail, but it changes the whole model. A shift may start at 06:00, yet employees still need time to get through security and walk to their workstation. So if that process takes 15 minutes, the gate arrival target is 05:45, not 06:00 (illustrative example) [2].
Once those inputs are combined, the model shows origin clusters, overlapping plant catchments, and a Scope 3 Category 7 baseline across the network [1]. In plain terms, you can see where plants draw from the same corridors and where route changes are most likely to matter.
Hans-Jörg Preining, Head of Sustainability & Securities at HYPO Oberösterreich, noted:
"The triply Mobility Audit is an excellent tool. The analysis took less than a week, and the data is precise and insightful. Employee mobility is a huge area where mistakes can be made, but triply helped us avoid that." [1]
With that baseline in place, you can test route and schedule scenarios before committing budget.
General information only, not legal or tax advice.
Start with the commute model. Use it to spot the corridors where demand is highest, then shape routes around those patterns.
A simple way to do this is to run one trunk corridor for shared demand and split it into plant-specific branch legs near each gate. That gives you one shared spine where rider volume is strong, instead of sending separate buses over the same stretch of road.
As demand thins out near individual plants or in more spread-out catchment areas, switch to smaller shuttles sized to match actual ridership. That keeps supply closer to demand and helps avoid half-empty vehicles rolling around for no good reason.
For schedules, use three layers:
That setup gives you a stable plan for day-to-day operations, plus enough room to deal with weekly changes and single-day disruptions.
Across every plant, the scheduling rule stays the same: design around badge-in deadlines, not shift start times.
That sounds like a small distinction, but it changes everything. A shift may start at 06:00, but if workers need time to walk in, change, and badge in by 05:50, then 05:50 is the time that matters.
Where public rail is available, shuttles should work as last-mile feeders timed to meet the S-Bahn or Regionalbahn. In other words, the shuttle shouldn't just show up near the station at some point around the train arrival. It needs to connect in a way people can actually use.
Night shifts need their own timing and capacity rules. Rail links often don't work the same way overnight, or they don't work at all. Because of that, night-shift routes should run independently, with right-sized vehicles instead of assumed rail connections [3].
Once routes are in place, test each corridor against the same network metrics instead of looking at each site through its own separate average.
| Metric | What it measures | Why it matters across plants |
|---|---|---|
| On-time arrival before the badge-in deadline | Share of riders delivered before the badge-in deadline | Directly tied to production line uptime |
| No-show rate | Booked riders who do not board | High rates signal a route design or schedule alignment problem |
Track these by corridor, by shift, and across plants. When you compare route-change scenarios against one another, instead of judging each plant on its own, the trade-offs become much easier to see before you lock in a new schedule.
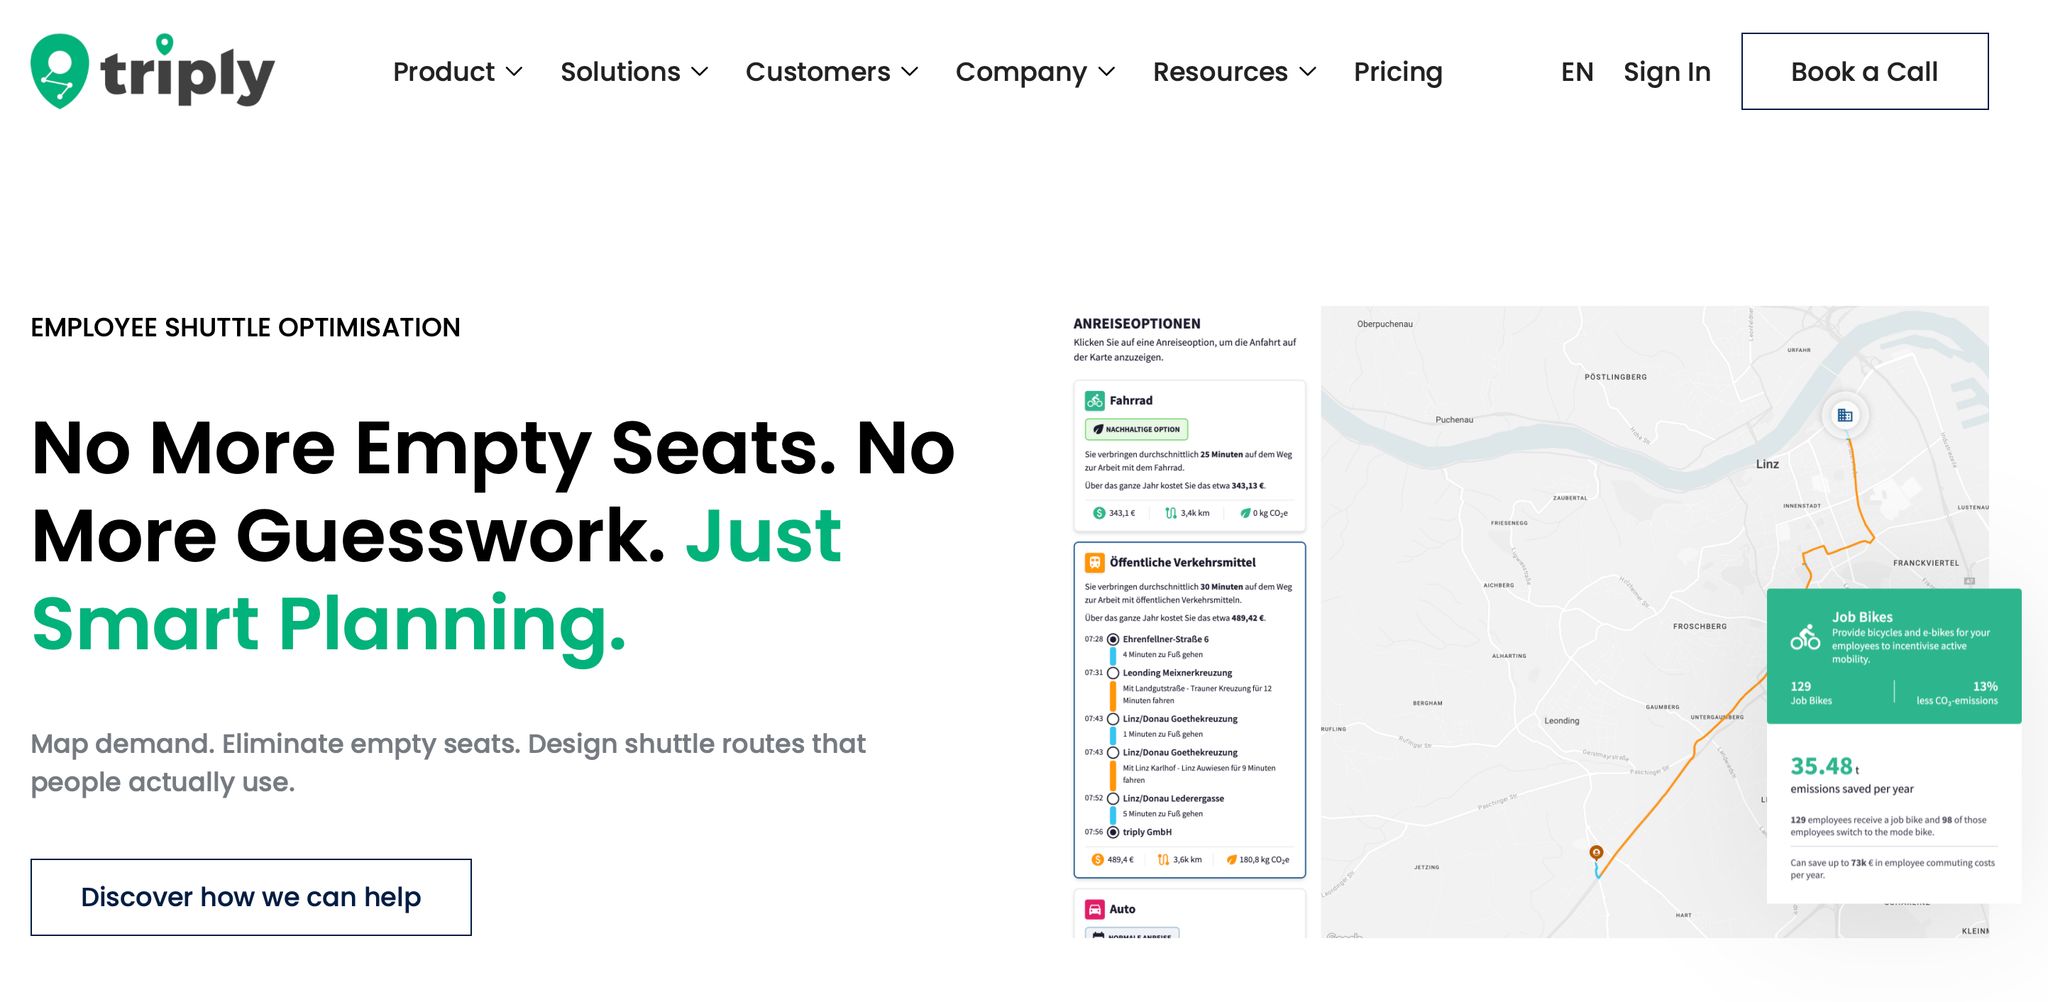
After you define the network, the next move is to test scenarios and get sign-off from one shared evidence base. With one shared commute model across all plants, you can use triply to test route and schedule scenarios before approving any changes.
The model shows where employee demand overlaps with existing routes, where routes are over- or under-served, and where changes to the network are likely to have the biggest effect. You can compare each option using the same set of facts: load factor, cost per boarded rider, and Scope 3 Category 7 impact.
You can use that same model to answer each team's approval question without breaking the data into separate site views.
| Stakeholder | Approval need |
|---|---|
| Finance | Budget impact and avoided parking capex |
| Operations | Gate-time reliability and shift coverage |
| Sustainability | Scope 3 Category 7 impact |
| HR / Site leads | Employee access, uptake, and retention |
When everyone reviews the same simulated model, the trade-offs are out in the open before any contract is signed.
If you manage company shuttle transport across multiple plants, see how triply models employee shuttle optimisation across multi-site operations and book a demo to review your own plant data.
This article provides general information on multi-site shuttle planning and does not constitute legal or tax advice.
Analyse where your workforce lives across sites so you can spot overlapping commuting corridors and shared catchment areas. That gives you a clearer view of where shared transport might work instead of planning each plant in isolation.
From there, check the operational fit. Can one vehicle realistically serve more than one plant? Do your internal policies permit shared transport across sites? Those two points matter just as much as postcode data.
It also helps to focus on plants close to shared transport hubs and, where possible, line up shift start times. That can improve load factor and lower operating costs. In practice, this often means comparing consolidated route models with site-by-site planning to see which setup makes more sense on the ground.
This is general information, not legal or tax advice.
First, pull data together across all locations so you can plan past site-by-site silos. You need HR shift rosters, badge-in baselines, and rider origins to see headcount, actual weekday travel patterns, and stop clusters.
You should also gather operating constraints such as vehicle capacity, arrival time windows, and site-specific geofencing rules for gates and loading zones. This is general information, not legal or tax advice.
Plan night-shift shuttles across multiple plants as one coordinated network, not as separate site routes. Use area-based clustering to spot shared corridors, combine demand, and optimise across sites.
Build routes around actual arrival requirements, including walking and security buffers. Adjust vehicle allocation as occupancy shifts, use fixed routes with flexible capacity where needed, and check employee locations against local public transport to avoid overlap. This is general information, not legal or tax advice.



