
Map employee origins, set constraints, model demand, calculate cost per boarded rider and emissions, then set clear go/no‑go thresholds.

A shuttle can look fine in a plan and still fail once you map actual home postcodes, shift times, stop access, and route limits.
Here’s the short version:
A few numbers matter early. A stop catchment of about 400 m is a common planning input. Peak load factor often works best around 60% to 80%. Below 50% can point to weak use, while above 90% can mean crowding. For reliability, many teams target over 95% on-time performance.
What you should be looking for is simple: Does this corridor have enough demand, at the right times, at a cost that makes sense? If you cannot answer that with data, you’re not ready to sign.
| What you should test | What learning you derive from it |
|---|---|
| Corridor fit | Whether employee clusters line up with a workable route |
| Ridership | How many people may board by stop, day, and shift |
| Service rules | Whether ride-time, pickup windows, and capacity still work |
| Cost | Total route cost and cost per boarded rider |
| Emissions | Whether the shuttle lowers commute-related Scope 3 Category 7 output |
In other words: before procurement starts, you want one model that shows demand, cost, and emissions side by side.
Route design should begin with the basics: where employees live, when they need to be on site, and which limits you can't bend. Skip that, and you can end up modelling a corridor that looks fine on paper but falls apart in practice. These inputs shape the route an operator can run in the real world. Use the corridor map to sort workable routes from dead zones.
Start with postal code data from your HRIS, not self-reported surveys. Then layer postal-code clusters, site locations, and shift patterns on top of each other to spot corridors that can support a fixed route.
Fixed routes usually need enough rider density in each corridor and shift to pay off. Any set threshold should be treated as an example, not a rule for every case, and checked against your own site setup. For stop placement, plan around a 400 m walking catchment per stop [1]. After that, test those stops against your operating rules.
Before modelling demand, set your hard limits and policy rules. These are the rules your demand model has to follow, not side notes. Use time windows first, then let the model optimise pickup order.
Hard constraints must hold: vehicle capacity, shift start times, accessibility, and any transport and labour rules that apply. Policy constraints have some room to move: maximum ride time, earliest pickup, and latest arrival time. A ride-time cap is a common policy rule, but it should be based on what your workforce will actually accept, not on a fixed number used without context [2].
Also, build stop dwell time into the model, especially at high-volume or accessible stops. Boarding time can change which schedules are feasible.
Once the corridor and constraints are set, test who would actually switch to the shuttle.
This is general information, not legal or tax advice.
Operators may hand you a ridership estimate based on what they’ve seen in other places. That can be a useful starting point, but it shouldn’t be your planning basis. Build your own demand model before procurement so the numbers reflect your workforce, your sites, and your travel patterns.
Start with the corridor data, then model who would actually get on the shuttle. Use your mapped origin clusters and shift windows. From there, treat the switch rate as a scenario input shaped by parking, ÖPNV access, and whether stops fall inside the 400 m walking catchment [1].
Don’t lock yourself into one forecast. Run three scenarios: budget, service, and balanced [2]. A range gives you a better planning base than a single point estimate, especially when travel behaviour can shift fast.
Then pressure-test that same demand by weekday, shift, and stop layout.
A route can look strong on paper and still perform very differently across the week. In practice, weekday and shift timing can change everything. Return-to-office patterns often cluster around Tuesday, Wednesday, and Thursday, so a route sized for those days may end up with a low load factor on Mondays and Fridays [5].
For peak periods, a healthy load factor target sits between 60% and 80%. Below 50% usually points to underuse. Above 90% often means crowding and a rougher rider experience [1].
| Variable category | What to test | Why it matters |
|---|---|---|
| Time | Weekdays, shift times (15-minute blocks), remote-work frequency [1][2] | Prevents over-capacity on low-demand days |
| Location | Walking catchment zones, stop layout, stop clustering [1] | Determines realistic uptake based on access |
| Service rules | Ride-time cap, pickup window, capacity [2] | Defines the service quality versus cost trade-off |
| Site conditions | Parking availability, ÖPNV quality at origin points [2] | Identifies where the shuttle is the stronger option |
It also helps to test stop consolidation against the 400 m walking catchment and model the effect on uptake [1]. That step shows whether consolidation still works in practice before you commit to a timetable or vehicle count.
This is general information, not legal or tax advice.
Once demand is modelled, the next step is to turn it into route economics and emissions. Finance and sustainability should be using one shared model, not two separate spreadsheets. That way, you can work out total route cost, cost per boarded rider, and the Scope 3 Category 7 impact before you even start talking to an operator.
Start with the cost inputs. That usually means cost per kilometre for fuel and maintenance, plus cost per driver hour for wages and benefits. Then layer in the full operating picture:
From there, calculate cost per boarded rider by dividing total route cost by modelled boardings. Use stop-level boarding estimates by time block [1].
Don’t bet the whole case on a single scenario. That’s how teams end up with a neat spreadsheet and a messy launch. Run different scenarios by changing vehicle size, frequency, service hours, fleet count, or ride-time limits. This gives you a clearer view of how the route holds up under different demand patterns [2].
triply lets you test vehicle size, frequency, and service hours before operator commitment. Then compare route cost with the commute baseline.
Use the same model inputs to compare today’s commute with the shuttle scenario. For Scope 3 Category 7, begin with a current commute baseline. Estimate drive-alone share, trip length, and commute days. Then calculate avoided car kilometres by comparing that baseline with the shuttle scenario and subtracting the shuttle’s own emissions [4][1].
Keep the assumptions aligned on both sides. Use the same origin clusters, shift windows, and load factor assumptions in each case. If finance and sustainability are working from one model, the go or no-go call rests on the same set of facts.
This is general information, not legal or tax advice.
Turn the model into a clear go or no-go decision before operator talks start. You should know the exact numbers that make you sign, and the exact numbers that mean you walk away.
Set thresholds across four areas. Focus on peak load factor, keep on-time performance at or above your target, compare cost per boarded rider with your commute baseline, and make sure Scope 3 Category 7 leads to a measurable reduction.
| Threshold | Benchmark | Decision gate |
|---|---|---|
| Peak load factor | 60% to 80% occupancy [1] | Sign-off range for route efficiency |
| On-time performance | >95% [1] | Service reliability gate |
| Cost per boarded rider | Lower than your commute baseline, with a target 30% to 50% reduction versus private car commuting cost [3] | Finance sign-off gate |
| Scope 3 Category 7 reduction | Measurable Scope 3 Category 7 reduction | Sustainability sign-off gate |
Mark hard constraints as non-negotiable. Mark policy constraints as trade-offs before any operator conversation begins.
If the modelled results sit in a grey area, use a shadow planning phase before a live pilot. Running optimised routes in parallel with current operations for 15 to 25 days can help you spot site constraints early, like unsafe turns or local stop rules [2]. This is general information, not legal or tax advice.
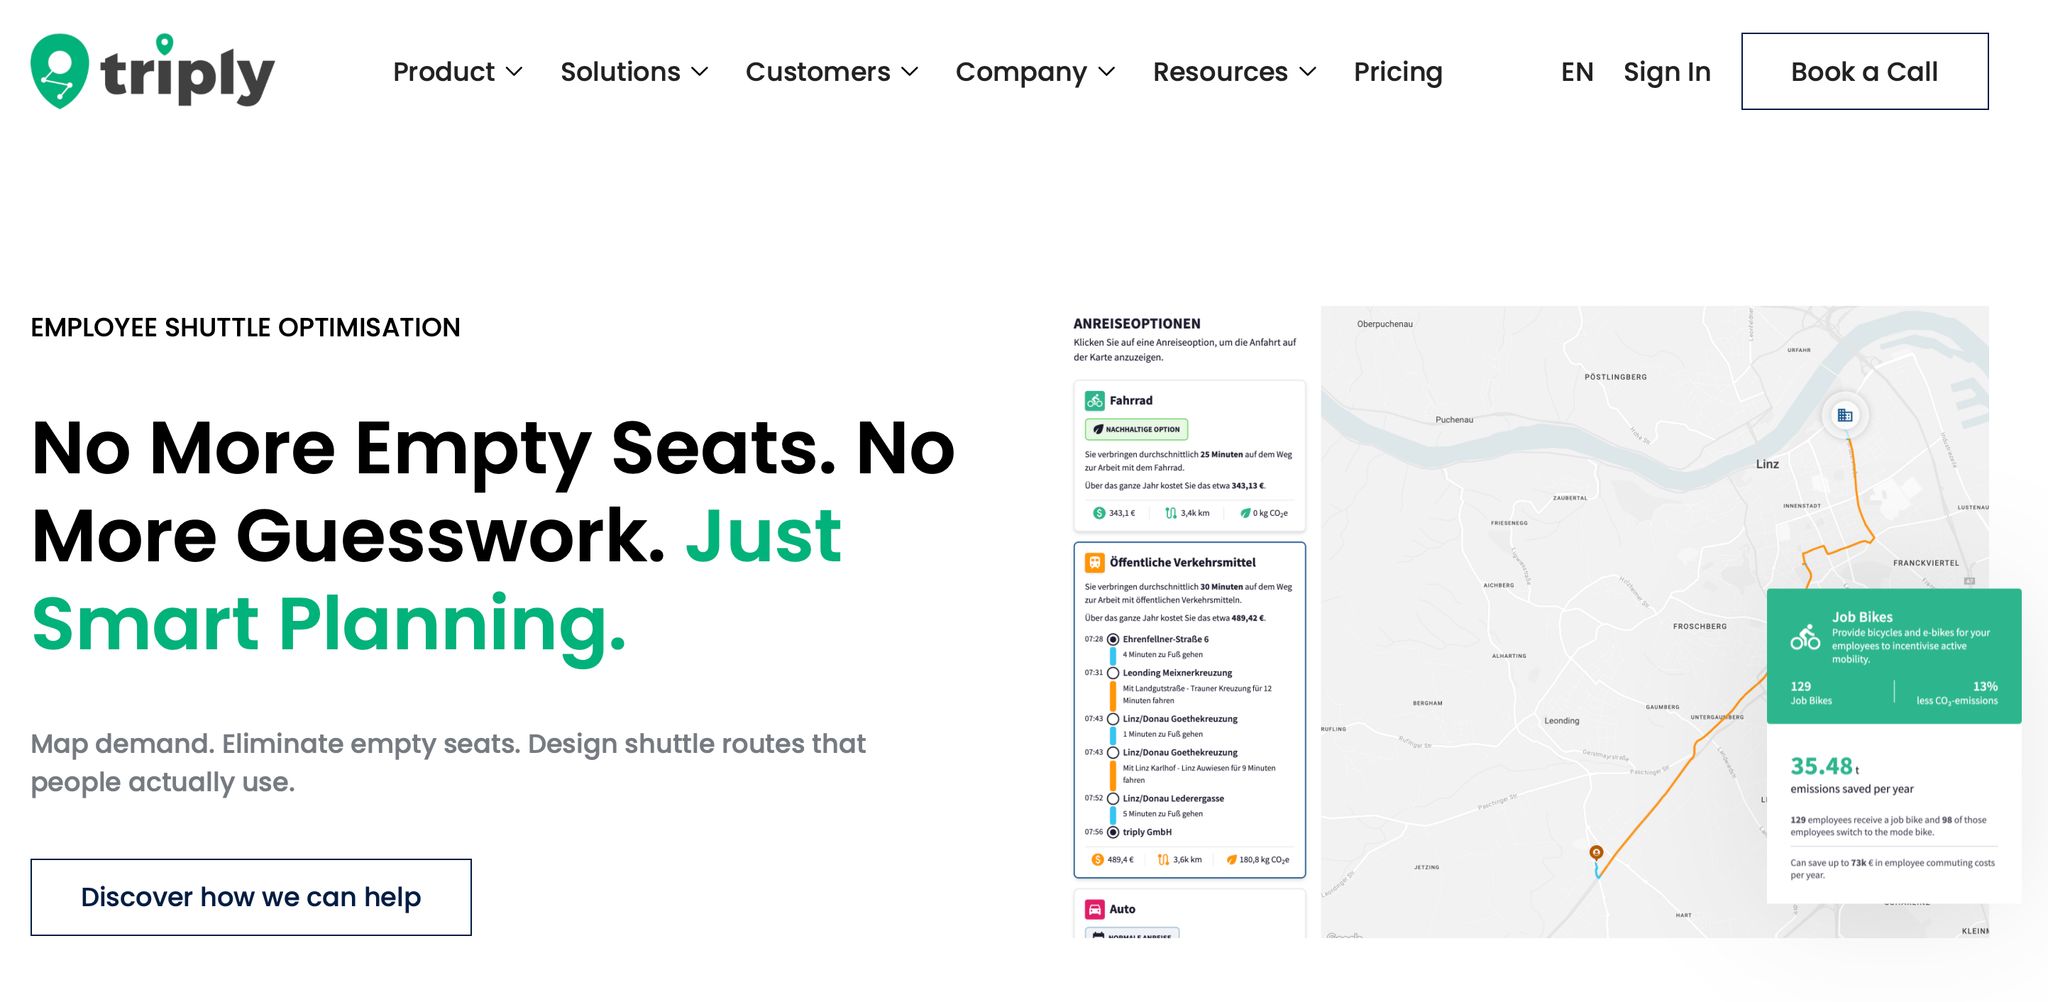
If you want to check that decision against your own site data, use triply before you commit. Book a triply demo and test your first corridor with real data before you sign anything, or visit the employee shuttle optimisation page to see the full approach.
Before you test a shuttle route with an operator, you need a clear picture of how, when, and where your employees travel.
That usually means collecting mobility survey data, such as:
You’ll also need boarding and alighting counts by stop, often in 15-minute intervals. On top of that, it helps to review local public transport timetables and walking connections. That makes it easier to spot gaps in service and see where a shuttle could make sense.
This is general information, not legal or tax advice.
There’s no single fixed employee count that makes a route work. It comes down to your demand density, geographic spread, and vehicle capacity.
Before you sign a contract, map your employee mobility data. The goal is simple: find residential clusters and line demand up with shift times. That gives you a clearer picture of whether a route can work in practice, not just on paper.
A peak load factor of 60 to 80% is a common benchmark.
This is general information, not legal or tax advice.
Yes. A pilot is a smart way to check your route, demand, and costs before you lock yourself into a long-term operator contract. It gives you a data-based starting point, helps get everyone on the same page, and can cut costly changes later.
It also gives you room to test route efficiency, confirm load factor, and compare day-to-day results with your early simulations. That way, your final contract is based on what happens in practice, not just what looked good on paper.
This is general information, not legal or tax advice.



