
Use one consistent plan across sites: build baselines, model shuttles, transit support, parking, and monitor monthly KPIs.

If you run more than one site, one shared commute plan beats separate local fixes. Use the same rules, the same data points, and the same KPIs across every plant, office, and logistics site so you can compare costs, CO₂, parking pressure, and employee travel patterns in one view.
Here’s the short version:
A few points matter most:
The goal is not a perfect model on day one. The goal is a clear baseline that lets you decide where to spend € first and how to report commute emissions across the business.
Below, we sum up the article into a plain step-by-step view you can use.
Start by deciding which sites are in scope and who owns each part of the work.
A simple way to begin is with the sites where you can already collect comparable commute data. Then roll out the plan in phases. That gives you a clean starting point instead of trying to map every location at once.
It also helps to split high-volume sites from lower-volume sites early on. A site with a large employee base will need more attention than a smaller location, so your effort should match the scale.
In practice, governance tends to work best when one central owner leads the programme. Site leads in Operations, HR, and Sustainability can then handle local rollout, approvals, and day-to-day coordination.
Use the same reporting boundary for your sustainable mobility plan and Scope 3 Category 7 reporting.
Why does that matter? Because it keeps your commute plan and your emissions reporting on the same perimeter. That makes the numbers easier to compare and cuts down on confusion later.
You also need this alignment for local German obligations. This is general information, not legal or tax advice.
Before you collect anything, set the rules for data, privacy, works council involvement, and access.
Be clear on a few basics from day one:
That early agreement keeps the first modelling round consistent across sites.
Once scope and rules are set, build the baseline for each site.
Start with the scope and reporting boundary you’ve already set. Then gather only the data you need to model each site in the same way. You don’t need a perfect dataset on day one. You need a consistent one.
A simple rule helps here: use existing HR data first, then fill in only the gaps that matter for modelling. In most cases, the minimum inputs are:
That’s enough to get moving without turning the project into a giant data-cleaning exercise.
Once those inputs are in place, the model gives you a clear picture of how employees travel today. The main outputs are mode split by site, catchment areas, travel times, parking demand, and Scope 3 Category 7 employee commuting emissions.
This matters for more than reporting. The goal isn’t just to measure commuting for the sake of it. It’s to build one shared baseline that operations, finance, and sustainability can all work from.
When everyone uses the same baseline, planning gets a lot less messy.
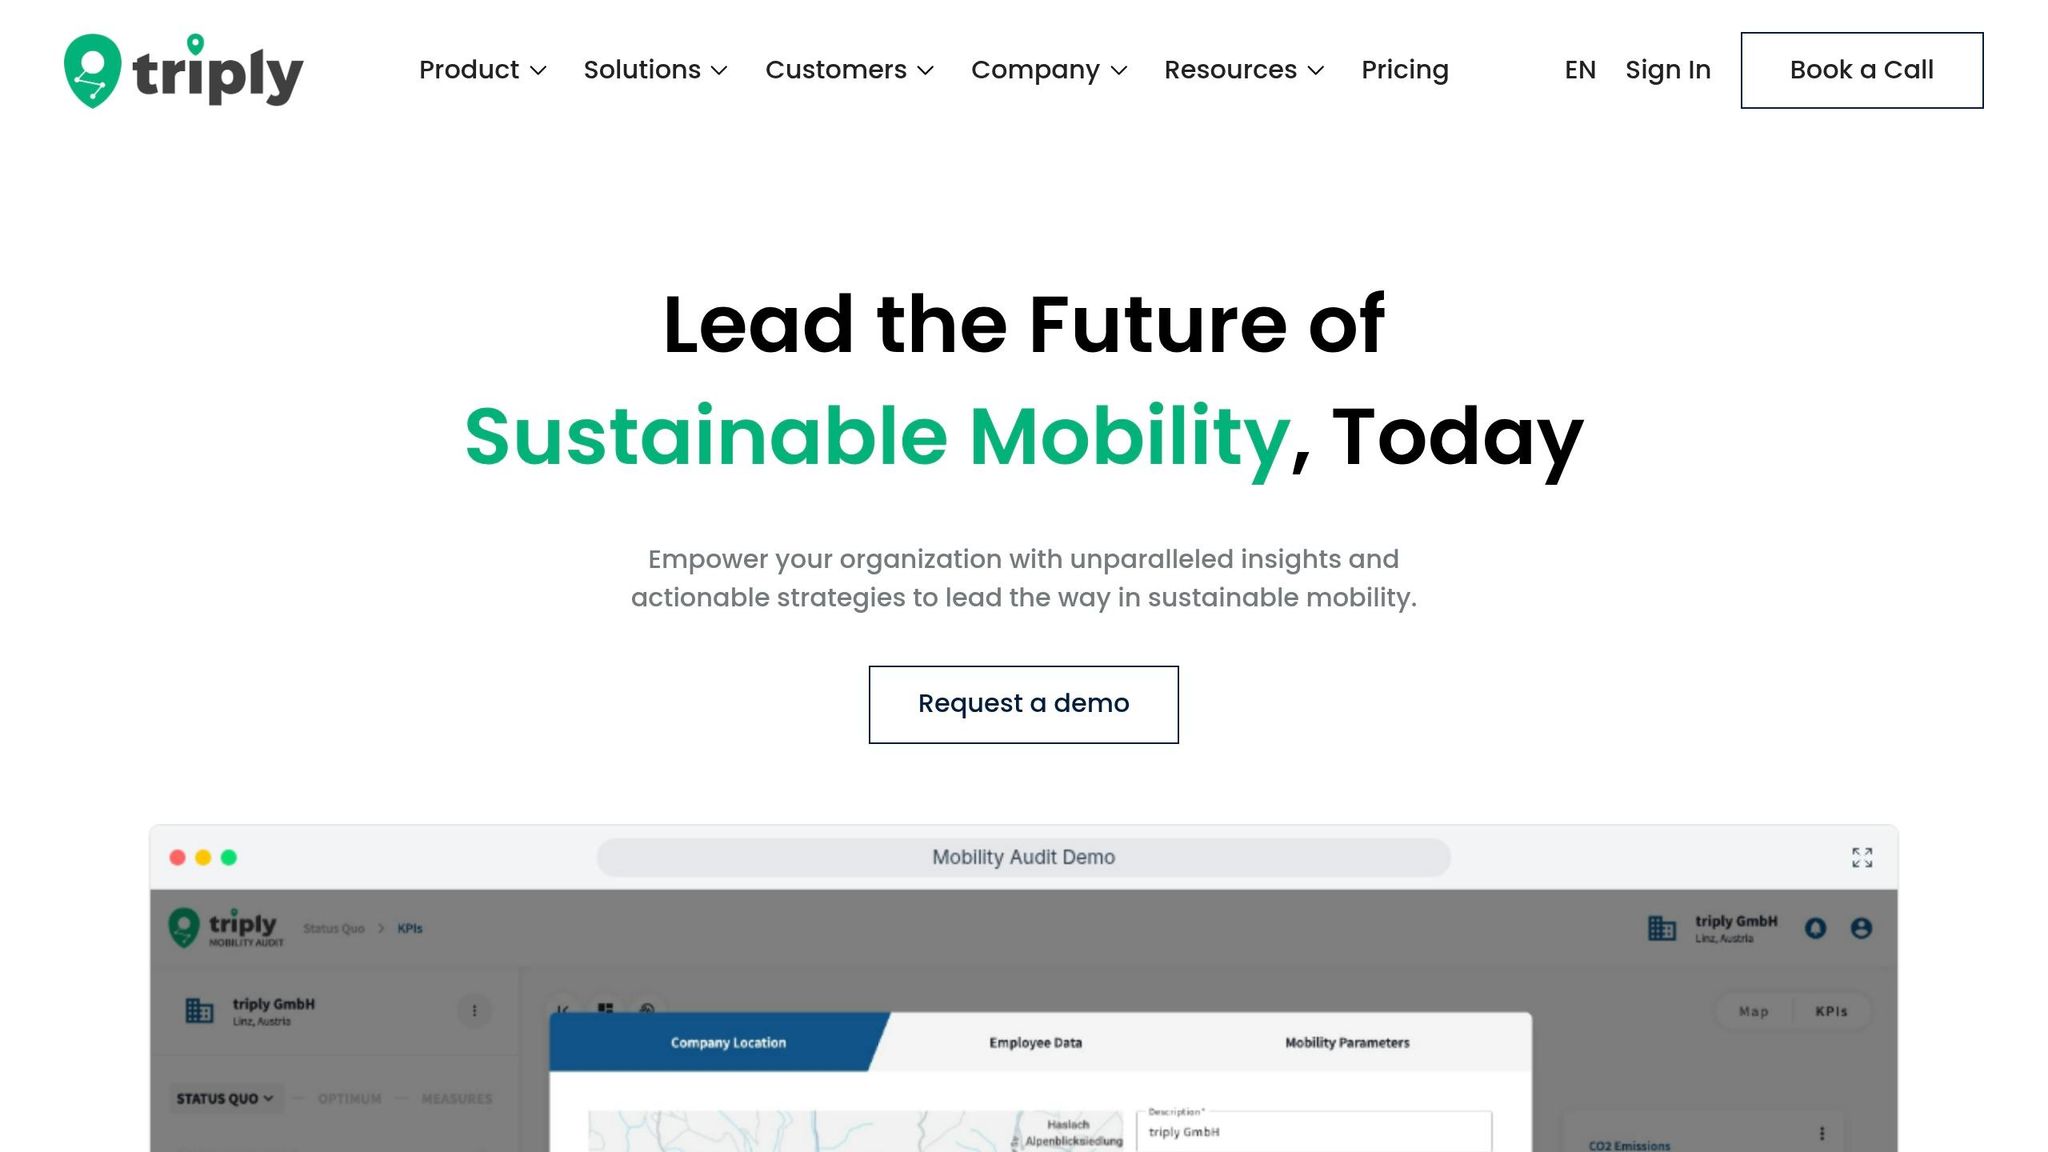
In most companies, the data is scattered. Some of it sits in HR systems. Some lives in parking records. Some is buried in shift plans. With triply, you can bring those inputs together into one consistent, site-by-site view.
That cuts out manual consolidation and gives you a baseline you can use for planning, Scope 3 Category 7 reporting, and measure simulation.
With that baseline in place, you can rank measures and test their impact before approval.
General information only, not legal or tax advice. Consult a qualified adviser for your specific obligations.
Set targets for each site using the same KPI set. A logistics site and a city-centre office should not have the same target values. Access, shift times, and parking conditions are different, so the targets should be different too.
Keep the KPI set small and consistent across all sites:
Using the same KPIs across sites makes life easier for finance. Teams can compare locations directly and back funding decisions with evidence, not gut feel.
These targets also help you rank which measures should be modelled first.
Your targets now show which measures are worth testing at each site. Use the KPI gaps from the baseline to pick the measures that address each site's biggest constraint.
In Germany, the main levers are:
Not every measure suits every site. Your baseline from step 2 shows which levers are worth testing, and where.
Instead of taking a proposal to finance based on assumptions, you can run scenarios in triply and show likely outcomes before any budget is committed.
For example, you might test a new shuttle route with different departure times, compare two levels of ÖPNV subsidy, or model what happens to parking utilisation if you add a modest daily charge. For each scenario, triply helps you compare projected uptake, load factor, cost per boarded rider, and Scope 3 Category 7 emissions impact. That makes it much easier to rank your shortlist on evidence rather than instinct.
Use the scenario results to compare measures on emissions impact, uptake, effort, and cost.
| Measure | Estimated emissions impact | Estimated uptake | Implementation effort | Relative cost |
|---|---|---|---|---|
| New employer shuttle route | High | Medium to high | Medium | Medium to high |
| Deutschlandticket contribution | Medium | High | Low | Low to medium |
| Carpooling incentive programme | Low to medium | Low to medium | Low | Low |
| Parking charge introduction | Medium | Medium | Low | Very low |
| Active mobility facilities | Low | Low to medium | Medium | Low to medium |
| Shift start time adjustment | Medium | Medium | Medium | Very low |
The figures above are illustrative and will differ based on your sites, workforce, and local conditions.
Share the modelled comparison with the works council and finance team to speed approval.
Once approved, these measures move into phased rollout and monitoring.
Once your measures are approved, it's time to move from planning into action. Turn the approved model into site-by-site delivery, starting with the locations that have the biggest commute impact and the clearest business case.
For each site in the first wave, assign a named owner, set a launch milestone that matches the shift schedule, and line up budget release with your internal approval cycle. Launch only after budget sign-off and works council alignment. Those aren't side notes. They need to sit inside the rollout plan from day one.
Use the first wave as a live test. It gives you a chance to check whether your assumptions hold up before you roll out to more sites. That makes the next wave easier to plan and less risky.
Once the first sites are live, take what you've learned and use it to fine-tune the next phase. A phased rollout cuts risk and helps teams learn faster across plants, offices, and logistics sites.
After launch, compare what happens on the ground with what the model predicted. Look at actual uptake, load factor, cost per boarded rider, and Scope 3 Category 7 emissions against the figures from your pre-investment model.
If actual load factor stays below the modelled estimate, the issue may be route timing, catchment area, or communication. If cost per boarded rider comes in above plan, you may need to revisit the subsidy level or vehicle capacity.
Do not wait for the annual review to act. Set a monthly check-in during the early rollout period. That rhythm helps you spot issues while there's still time to fix them.
If site conditions change, such as shift pattern changes, workforce growth, or local transit changes, update the model in triply and rerun the scenarios that changed. Keep the plan tied to current conditions, not old baseline assumptions.
See how triply's employee shuttle optimisation use case turns commute modelling into route and schedule decisions. Request a demo.
Start by focusing on the sites where action is most likely to make the biggest difference, and where your data is solid enough to support a clear baseline, target setting, and the right measures.
For a multi-site employer, this makes it easier to build the sustainable mobility plan in a practical order and report progress more clearly. This is general information, not legal or tax advice.
If your commute data is incomplete, start with the best information you have and flag any gaps clearly. What matters most is using the same baseline across all sites, so you can compare results properly and tighten up accuracy over time.
The original answer doesn't address the question at all. It seems to include unrelated details about mathematics awards.
To keep the meaning accurate and avoid adding facts that aren't supported, this FAQ answer should be replaced with content about how long you should monitor after launch.



