
Use anonymised postal codes, shift times and site limits to design, pilot and scale cost-effective employee shuttles and cut commuting CO2.

If you want an employee shuttle to work, start with commute data, not guesses. The article’s main point is simple: You can use anonymised PLZ, shift times, site rules, and current travel patterns to decide where a shuttle should run, when it should arrive, and whether the numbers work before spending €1.
In plain terms, the article says you should:
A few numbers stand out straight away:
The article does not tell you to start with full home addresses or a big employee survey. Instead, anonymised data can be enough to build a first model, check demand, compare current commuting costs with shuttle costs, and set rules with HR, finance, facilities, sustainability, and the Betriebsrat from the start.
Quick comparison
| Step | What I’m trying to answer | Main input | Output |
|---|---|---|---|
| Data audit | Do I have enough to start? | PLZ, shifts, site limits | Base commute model |
| Corridor check | Where can a shuttle work? | Demand clusters, timetables, parking data | Ranked corridors |
| Route design | What service type fits? | Arrival deadlines, stop logic | Timetable and route option |
| Cost check | Will people use it at a fair cost? | Vehicle size, demand, route time | Load factor and cost per rider |
| Governance and pilot | Can I run it in a controlled way? | KPI targets, SLA, safety rules | Pilot plan |
| Scale-up | Should I expand to more sites? | Pilot results, site data | Next routes and rollout order |
So the short version is this: the article shows you how to turn commute data into a shuttle plan, a finance case, and an emissions view in one flow. The rest of the piece explains how to do that step by step.
You do not need home addresses to get started. For many large employers, anonymised home postal codes (Postleitzahlen, or PLZ), work site locations, shift schedules, and site access limits are enough to map commuting patterns in a useful way.
The core inputs are pretty simple: headcount per site, shift start and end times, including night shifts and rotating patterns, plus any site limits such as parking capacity or gate access rules. In Germany, it makes sense to involve the Betriebsrat early and line up data collection with DSGVO rules. This is general information only, not legal or tax advice.
Once you have those inputs in place, you can build a site-level commute model and turn raw employee location data into route-ready demand.
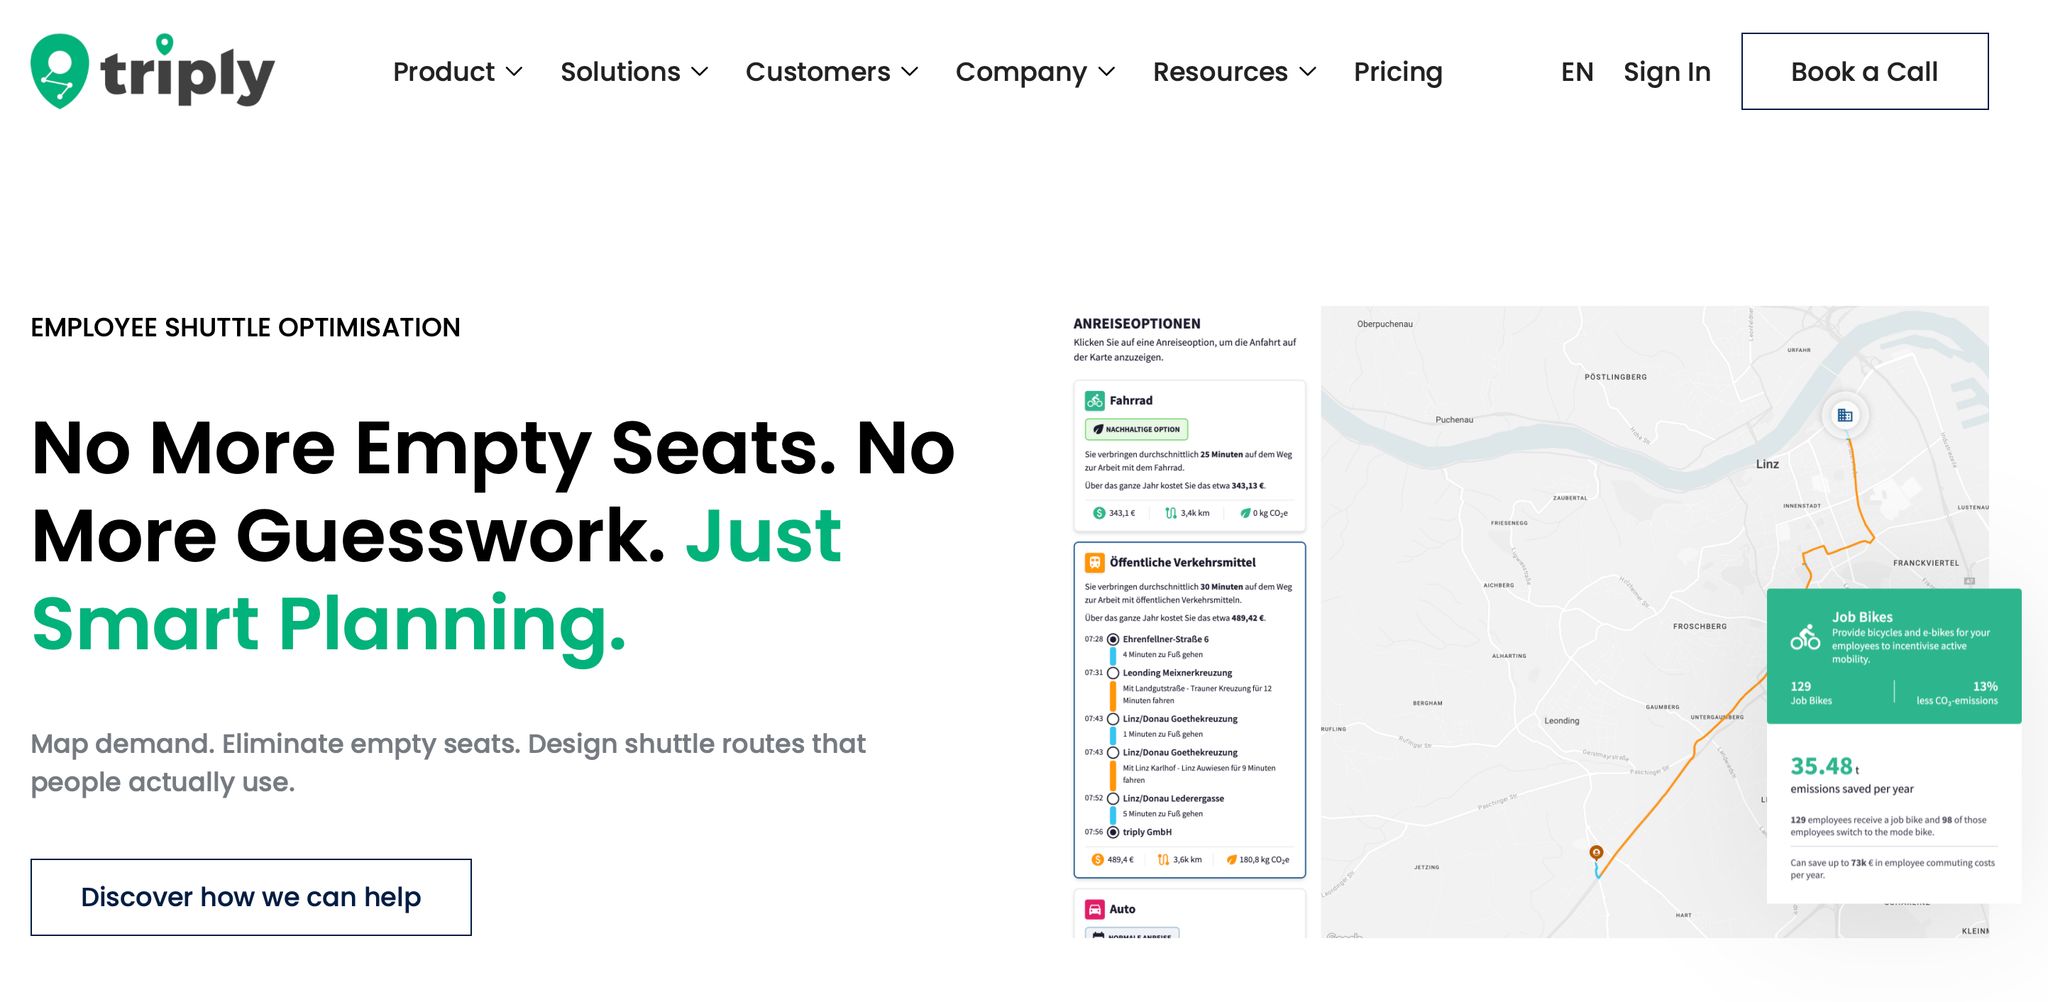 With those minimum inputs, triply turns your data into a site-level model of where employees come from, how they travel, and which corridors carry the most demand. This is the point where raw commute data starts becoming usable route demand.
The model looks at three things:
Schedule planning should match the actual arrival requirement, not just the shift start time. That means factoring in walking time and security checks too. For manufacturers and other large employers running multi-shift operations across several sites, this matters a lot.
Next comes the filtering step: separate viable corridors from low-density commuting patterns. Not every corridor can support a shuttle, and that’s the whole point of the analysis.
You’re looking for a mix of signals. Maybe there are residential clusters lined up along one shared corridor. Maybe ÖPNV, local and regional public transport, does not line up with shift times, so employees end up relying on private cars. Maybe the site is already under parking pressure. Or maybe the gap is the last mile from a rail node such as an S-Bahn station or Regionalbahn station. Put plainly, this is where you work out which corridors are worth serving.
The table below shows the main analyses at this stage and what each one tells you:
| Analysis | What it reveals | Primary data input |
|---|---|---|
| Cluster analysis | Dense origin points worth serving | Anonymised PLZ |
| Transit gap analysis | Weak ÖPNV links vs. shift times | Public timetables, shift rosters |
| Mode split analysis | Current car vs. transit usage baseline | PLZ, current mode rates |
| Temporal demand analysis | Peak and off-peak service windows | Shift rosters, badge-in data |
| Parking utilisation | Pressure justifying a modal shift | Facilities management data |
These baselines then feed into route design, capacity planning, and cost modelling in the next phase.
At this stage, you also get baseline metrics such as corridor travel times and current mode patterns. A healthy shuttle system often aims for a 60–80% load factor during peak hours as an illustrative benchmark. [2] If your demand clusters don’t support that range, you’ll know it before you design a single route.
Before you map a route, get clear on the problem the shuttle needs to fix. That decision shapes everything else: which sites come first, which shifts need cover, and who can ride.
A full car park needs a different setup from a site dealing with gate queues before the early shift. The table below links each business goal to the metric that shows whether the shuttle is doing its job.
| Business Objective | Primary Metric | Data Source |
|---|---|---|
| Reduce parking pressure | Parking occupancy rate / parking lease costs | Facilities or security logs |
| Improve shift access | On-time arrival rate / absenteeism | HRMS / Shuttle App |
| Lower Scope 3 Category 7 emissions | Tonnes of CO2 reduced annually | Fleet telematics / Fuel data |
| Cost efficiency | Cost per boarded rider / load factor | Billing / Passenger counters |
Once the objective is set, define rider eligibility using the same inputs already in the commute model. In practice, each rule ties back to a variable you already have, such as:
Set those rules early. It keeps the pilot under control and stops the scope from drifting.
Start with the ranked corridors from the commute model and use them to pick your first route option. At large employer sites, three route types usually handle most cases:
Build the timetable around arrival deadlines, not the posted shift start time. That means allowing for the walk from the drop-off point to the workstation, plus any hold-up at security checks.[6] Looking at boarding demand in blocks, such as 15-minute intervals as one sample method, helps you spot whether demand is packed into a short window or spread out enough for a less frequent service.
Load factor is the share of seats filled on a trip. Cost per boarded rider is the total route operating cost divided by the number of passengers who board.
Vehicle size should match peak demand from the commute model. A route serving a dense corridor with steady shift waves may support a larger coach. As an example, 30 to 50 seats can make sense in that case. A last-mile rail link, by contrast, may work better with a smaller minibus running more often.
triply lets you test route variants and headway intervals before you sign a contract, so you can compare scenarios side by side on load factor and cost per boarded rider. The table below shows how the main route types often perform across those two measures.
| Route Concept | Use Case | Likely Load Factor Pattern | Cost per Boarded Rider Tendency |
|---|---|---|---|
| Direct route | High-density residential clusters | High peaks during shift changes | Lower, due to high occupancy |
| Hub-and-spoke | Distributed workforce near transit hubs | Consistent across shift windows | Moderate |
| Last-mile link | Sites near major train stations or park-and-ride sites | High frequency, short trips | Moderate to high |
| Parking shuttle | Constrained on-site parking | Constant loop during shift changes | Lowest, due to high volume and short distance |
These load factor and cost per boarded rider patterns are illustrative benchmarks, not promises. Results will vary by site, workforce distribution, and day-to-day operating conditions.
Stop dwell time also matters. Every extra minute a vehicle sits at a stop adds route time and pushes up cost. That’s exactly why it makes sense to model this before launch.
Use these outputs in the business-case scenarios that follow.
Start with what you already pay for commuting today. Before you take a shuttle proposal to finance, build a clear baseline: parking lease costs, mileage reimbursements for employees using private vehicles, and site access costs like off-site overflow parking. These figures should come from the same demand model used to size the shuttle.
triply's simulation output shows load factor and cost per boarded rider for each route option. That gives finance a simple side-by-side view: one contracted shuttle service versus the scattered costs it could replace. You don't need a perfect forecast at this stage. A directional comparison is enough to move the discussion forward.
That same scenario set also feeds the emissions case and later governance choices.
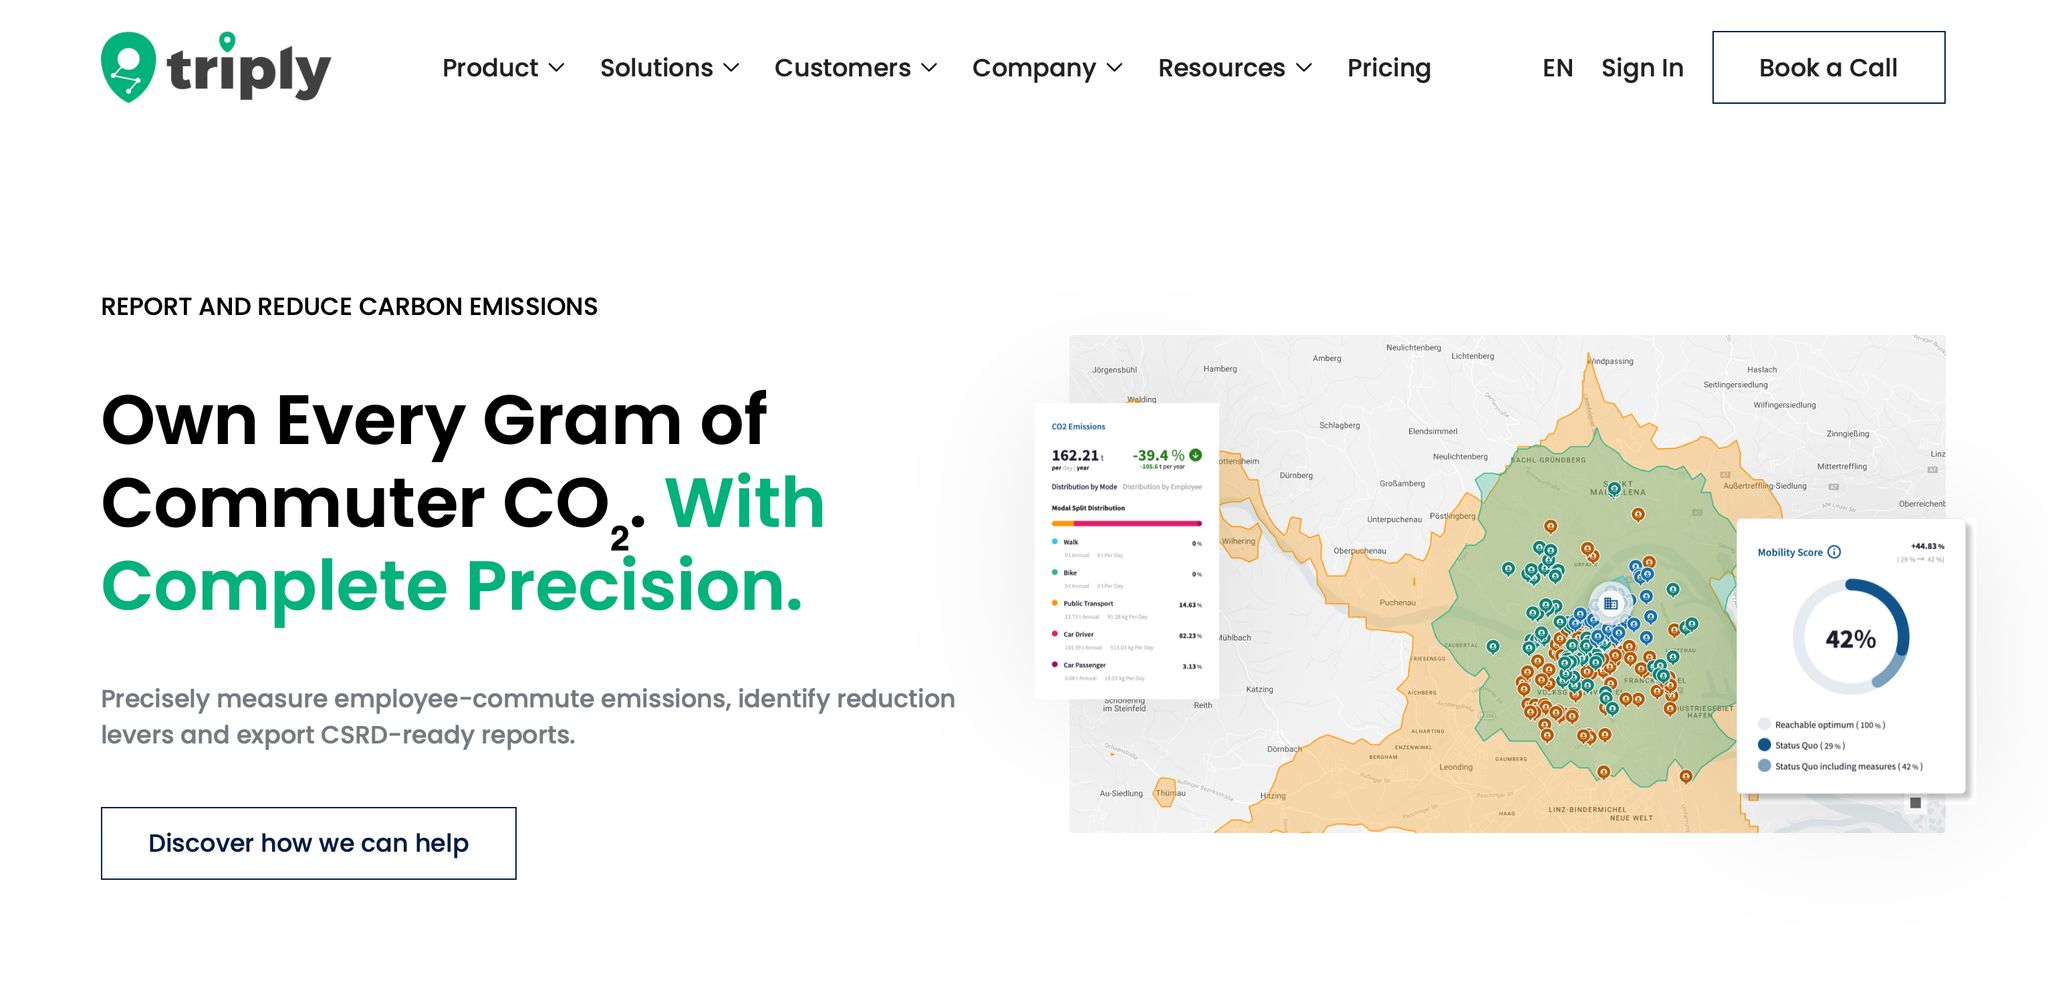 Employee commuting falls under Scope 3 Category 7 [4][7]. If your company reports under CSRD or ESRS E1, this category is getting more attention, and a shuttle programme can cut it directly.
A shuttle reduces per-passenger emissions when it replaces single-occupancy car trips. A full shuttle bus generates roughly 70% lower per-passenger CO2 emissions than individual car commutes [9]. The exact figure for your programme will depend on vehicle type, route length, and average occupancy. For example, a 40-seater corporate coach replacing 25 private cars can save more than 20 tonnes of CO2 per year, depending on route length [4].
The useful part here is consistency. The same commute model that sizes the shuttle and simulates uptake also produces the emissions baseline and projected reduction. So your planning data and your Scope 3 Category 7 reporting stay aligned and traceable.
A shuttle programme cuts across several teams: mobility or facilities, HR, sustainability, operations, and finance. Budget usually sits with finance or facilities. HR should be involved when the shuttle is positioned as an employee benefit. Sustainability should be involved when emissions reduction is part of the goal.
Service standards should be written into the service-level agreement from day one, including:
Track punctuality and boarding every week. Then review cost per boarded rider, load factor, and emissions each month.
On safety and duty of care, document driver verification, GPS tracking, and geofencing for all shifts. Bring in the works council (Betriebsrat) early, especially if commute time or shift scheduling may be affected. This is general information, not legal or tax advice.
Once governance is in place, launch the pilot on the strongest corridor.
Use the ranked corridor and baseline metrics from your commute model to pick the pilot route. Start with the corridor that shows the highest demand, and run a single-site, two-shift pilot. That gives you a clean way to test occupancy, timing, and rider response without making things too complex on day one.
Before the first bus starts service, write down your success criteria. Don’t leave this vague. If the team agrees on the targets up front, it becomes much easier to judge what’s working and what needs fixing. The table below shows sample thresholds you can adjust to fit your setup.
| Pilot Evaluation Criteria | Success Threshold (Illustrative) |
|---|---|
| Load Factor (Peak) | 60%–80% |
| On-Time Performance | > 95% |
| Cost per Boarded Rider | Corridor-dependent |
| Empty-Kilometre Ratio | < 15% |
| Employee Satisfaction | > 4.2 / 5.0 |
| Safety Compliance | 100% |
Run the pilot for 8 to 12 weeks as a sample window. The first weeks are often a bit messy while riders settle into the new routine. By the middle of the pilot, patterns usually start to show. By the end, you should have steady benchmarks you can use for decision-making. It also makes sense to plan for route and schedule changes in weeks 6 to 8. That kind of tuning is normal. It doesn’t mean the programme is off track.
Use QR codes or short digital surveys on board to gather employee feedback on stop locations, departure times, and comfort.[4][8] That keeps riders involved and gives you useful comments to compare with the operating data.
Use pilot data to fine-tune stop spacing, buffer time, and vehicle size. Track efficiency, reliability, cost, and satisfaction. Each metric helps you decide whether a corridor should stay as it is, be adjusted, or be removed.
If on-time performance slips, add buffer time at stops that connect to public transport. If the no-show rate goes above 8%, riders usually need automated reminders.[3]
Load factor is one of the clearest signals. If peak occupancy falls below 50%, remove weaker stops or switch to a smaller vehicle. If it stays above 90%, add capacity before crowding starts to hurt satisfaction.[2][3]
Once the first corridor stabilises, repeat the same simulation for the next site. The modelling logic you used for the first corridor can be applied directly to the next one.[5] Re-run the commute simulation for each added site and move the strongest candidates to the top of the list.
As you add sites, connect consecutive trips to cut empty kilometres. The same commute model can also support your Scope 3 Category 7 reporting for each new corridor, so planning data and emissions reporting stay aligned as the programme grows.[2][4]
triply's commute modelling and simulation capabilities support multi-site expansion by bringing data from several sites into one view. You can also rerun scenarios as headcount or shift patterns change, so finance, sustainability, and operations can work from one credible dataset.
The same commute model can then support each new site as you expand.
This is general information, not legal or tax advice.
You can start with a small set of high-quality data. For early modelling, even two or three solid inputs usually beat gut feeling.
Useful inputs include:
This gives you a clearer view of demand, helps you shape routes, and lets you size your fleet before you set a budget.
This is general information, not legal or tax advice.
Choose your first employee shuttle program route based on data, not guesswork. Map anonymised employee home locations to spot high-density clusters. Then compare those clusters with shift schedules and headcount to see where demand is strongest and where public transport falls short.
Start with a pilot route for a large site with steady peak-hour demand. In most cases, the best first route links a high-volume origin cluster with your workplace, so you can support strong occupancy from day one.
This is general information, not legal or tax advice.
Your employee shuttle program pilot is ready to scale when the numbers hold up over time. Consistent demand and reliable operations are the big signals to watch.
Look at whether the load factor stays at a healthy level, on-time performance remains strong, and the service can take on more riders without running into problems. A one-off good week isn't enough. You want to see steady results across normal operations.
It also needs to back your business goals. That can mean better employee satisfaction, lower parking or mileage costs, and progress on sustainability targets. If those results stay steady across different shifts and locations, you have a clear case for expansion.
This is general information, not legal or tax advice.



