
One verified commute model aligns shuttle costs, load factors and Scope 3 Category 7 emissions for clearer budgeting and CSRD reporting.

If your teams use different commute data, they will get different answers. For large employers in Germany, one employee commute data set can support shuttle cost control, Scope 3 Category 7 reporting, and site planning at the same time.
Here’s the short version:
In other words: if you want clean reporting, lower wasted shuttle spend, and better route choices, you need one shared commute model.
A simple way to think about it:
| Area | What you need from the same data |
|---|---|
| Finance | Cost per boarded rider and route spend |
| Sustainability | Scope 3 Category 7 emissions |
| Site teams | Load factor, demand hotspots, and corridor fit |
We’d sum the article up like this: build the baseline once, validate it, test changes before spend, pilot one corridor, then scale with the same numbers across all teams.
Employee transportation management means planning, providing, and analysing how employees get from home to your sites. That includes shuttles, ÖPNV (public transport in Germany), carpooling, cycling, and walking. A clean commute data set links cost, carbon, and compliance in one shared commute model.
Corporate mobility analytics is the decision layer on top. It doesn’t just ask whether a shuttle exists. It asks what the cost per boarded rider is, what load factor it reaches, and how much it adds to your Scope 3 Category 7 emissions. For you, this is about more than transport operations. It gives finance, sustainability, and site operations one common basis for decisions.
triply uses corporate mobility analytics to model commute demand and test measures before investment. It is not a dispatch tool and does not manage day-to-day trip operations.
You can start with a small, practical data set. The best place to begin is the data you already own:
With these inputs, triply models actual commutes for every employee at every site, maps corridor density, and shows cost per boarded rider, load factor, and Scope 3 Category 7 emissions. The next section explains how one commute data set turns into cost, carbon, and compliance metrics.
One commute model can give you three outputs from the same data set: cost per boarded rider, load factor, and Scope 3 Category 7.
These three metrics sit at the centre of a large employer's employee transportation management programme, and they all come from the same underlying data set [1].
Cost per boarded rider is total operating cost divided by boarded riders. Finance teams use it to benchmark routes, plan budgets, and track changes over time.
Load factor compares actual boarded riders with the vehicle's seat capacity on each trip. It shows, in plain terms, whether you're paying for half-empty vehicles or running close to full.
Scope 3 Category 7 covers employee commuting emissions [1]. Under the GHG Protocol's distance-based method, you multiply rider-kilometres by the right emission factor for each mode [1].
The key point is simple: use the same baseline across sites, routes, and shift patterns. That way, each team is working from the same numbers instead of its own version of the story [1].
| Metric | Calculation | Primary use case |
|---|---|---|
| Cost per boarded rider | Total operating cost / boarded riders | Finance |
| Load factor | Actual boarded riders / vehicle seat capacity | Site operations |
| Scope 3 Category 7 | Rider-kilometres × emission factor | Sustainability, compliance |
Problems start when each team works in its own lane.
Finance may track direct spend on fuel and vehicle leases. Sustainability may depend on commute surveys that often reach only about a 23% response rate [4]. Site operations may still manage rosters by hand. On paper, each team is doing its job. In practice, they're often solving slightly different versions of the same problem.
That split leads to bad calls. If finance and sustainability use different assumptions about how employees travel, they'll end up with different answers. A shuttle expansion might look like a smart move to one team and a risk to another. Same plan, different baseline. That's where things go sideways.
It also makes forecasting weak. If each team has only part of the picture, no one can test a new measure with much confidence. The model is missing pieces, so the result is shaky from the start.
The reporting risk is just as direct. Survey-based estimates do not provide the transaction-level, verified data required for CSRD reporting [4]. When an auditor asks how you calculated your Scope 3 Category 7 figure, a trip-level distance record verified through booking or GPS data gives you a defensible audit trail [1][2][3].
A single verified commute model gives cost, carbon, and compliance teams one shared baseline. And that's what makes it possible to test measures before spending money on them.
This is general information, not legal or tax advice.
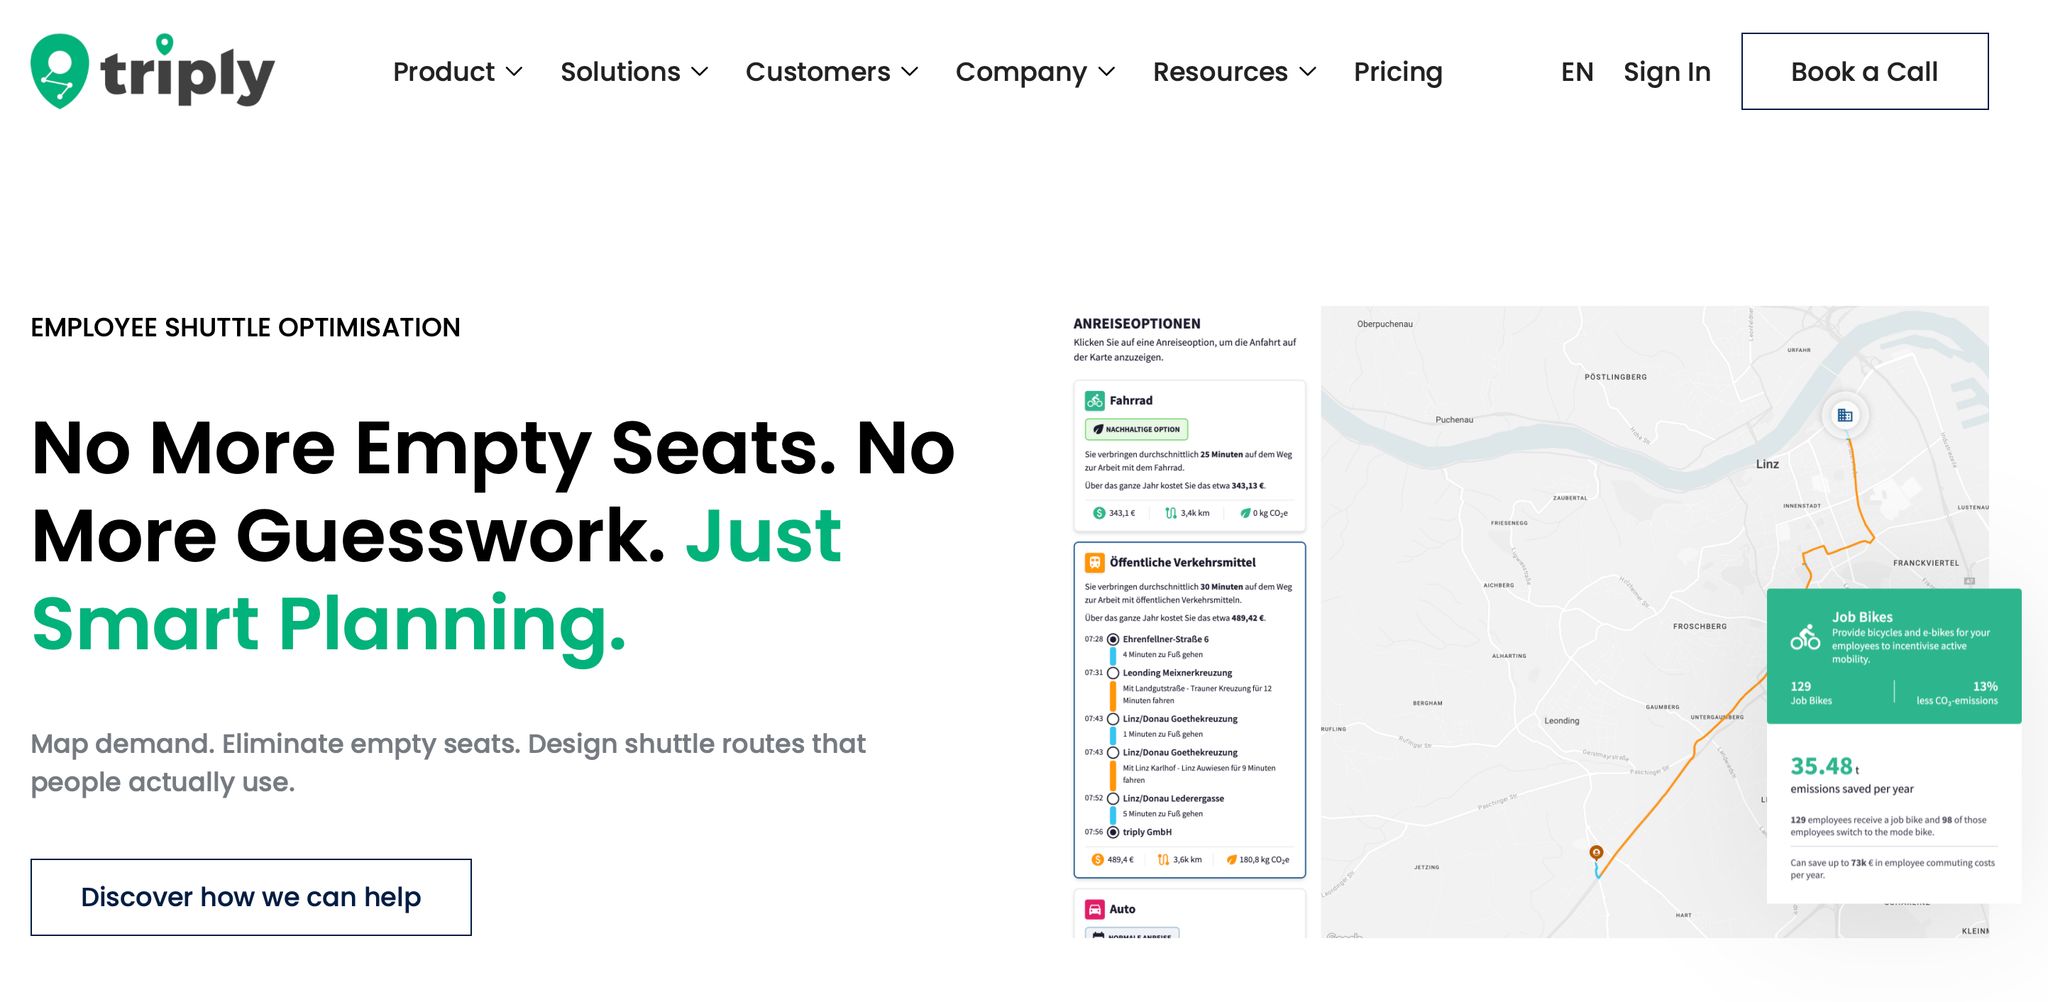
With triply, you use the same commute model to look at commuting patterns, bring site data together, simulate measures before you spend, and report Scope 3 Category 7 from one source. In plain terms: one model, one data base, several teams using it for different decisions.
That matters because you can test a plan before you put money behind it.
The starting point is a Mobility Audit. triply builds a baseline from HR data, with a focus on employee home postal codes (PLZ) and shift patterns. That baseline shows origin hotspots, points to the sites, roles, or shifts behind the highest cost and emissions, and highlights where load factor is lowest.
Once that baseline is in place, you can test options before locking in budget. Run Strategic Simulations to check route changes, subsidy levels, or service frequency and see how those choices may affect cost per boarded rider and Scope 3 Category 7. Any numeric results are illustrative projections based on your input data, not guaranteed outcomes.
That kind of pre-purchase testing helps cut the risk of underused shuttles and incentives aimed at the wrong groups.
The same commute model gives each team the output it needs, without anyone having to rebuild the data from scratch.
| Stakeholder | Primary output | Decision it supports |
|---|---|---|
| Finance | Route-level spend mapping and cost forecasting | Budget control and procurement justification |
| Sustainability | CSRD-ready Scope 3 Category 7 reports | Emissions reduction and regulatory compliance |
| Site operations | Hotspot maps and site mobility insights | Infrastructure planning and shuttle optimisation |
If you run multiple plants or large sites, triply pulls everything into one dashboard. Finance, sustainability, and site operations each get the view they need, but all of them work from the same verified commute evidence.
The next section shows how to roll this out across large sites and multi-site employers. For route-level planning, see the employee shuttle optimisation guide.
For large German sites, the rollout order should stay simple: data, validation, simulation, pilot, then scale.
At large German sites, rollout speed is shaped by a few on-the-ground factors: shift rotations, works council input, and patchy ÖPNV coverage.
Once you have your baseline, the next move is to validate it, test scenarios, and run a controlled pilot.
| Phase | Timeframe | What you do |
|---|---|---|
| Data gathering | Weeks 1-2 [1] | Pull home postal codes (PLZ) and shift patterns from your HRIS, such as SAP or Workday. Don’t rely on self-reported surveys. They’re often out of date or skewed. |
| Baseline modelling | Weeks 3-4 [1] | Build an origin heatmap. Spot dense corridors that fit fixed routes, and separate them from dispersed origins that need a dynamic or hybrid model. |
| Stakeholder validation | Weeks 4-5 [1] | Share the baseline with site operations, HR, and your works council (Betriebsrat). Check shift rotation assumptions, flag ÖPNV gaps that affect feasibility, and involve the Betriebsrat before you lock assumptions, especially where data privacy and benefit equity matter. |
| Measure simulation | Weeks 5-6 [1] | Run simulations to test route options or incentive changes. Treat the output as indicative projections based on your input data. |
| Pilot and KPI review | Weeks 7-12+ [1] | Launch on one high-density corridor. Track cost per boarded rider and load factor before rolling out to the full network. |
End-to-end rollout often takes about 60 to 90 days when HRIS integration runs in parallel with route design. [1]
The biggest early risk is waiting too long on HRIS integration. If you manage eligibility in spreadsheets at scale, billing errors start to creep in, and Scope 3 Category 7 reporting becomes much harder to back up. Bring HRIS and payroll into the pilot phase, not after the full rollout. [1]
General information only, not legal or tax advice.
The main point is straightforward: cost, carbon, and compliance are not three separate issues. They all come from the same commute data. Managing them in one model is both more efficient and more accurate than running three separate workflows.
Shared metrics, especially cost per boarded rider, load factor, and Scope 3 Category 7, give finance, sustainability, and site operations one common language. Pre-investment simulation cuts the risk of underused shuttles or incentives aimed at the wrong groups. And when you work from one verified data set, your CSRD reporting and budget decisions rest on the same evidence.
If you want to see how this works for your sites, book a demo of employee transportation management with triply.
A PLZ-based commute model has clear limits. It relies on static postal code areas instead of exact start-and-end trip data. That can work for rough, high-level estimates, but it often misses the detail needed for modern compliance and emissions reporting.
Modern employee transportation management works with verified trip data from actual journeys, which gives a more precise view. This is general information, not legal or tax advice.
Before rollout, make sure your data privacy approach protects anonymity and security. The system should give you mobility insights and emissions reporting at an aggregated, anonymised level. It should not track individual employee movements in a way that makes people identifiable.
Use strong identity management, such as SSO. And if you offer opt-in trip tracking, it should support verified audit trails, not workforce surveillance. Always consult your legal and data protection teams. This is general information, not legal advice.
You validate Scope 3 Category 7 figures by going beyond regional average estimates and building a verified audit trail from actual transaction-level data.
An employee transportation management system can use GPS-based trip checks or recurring transaction data to document mode shifts across your workforce and support automated, audit-ready reporting for frameworks such as EU CSRD or California SB 253. This is general information, not legal or tax advice.



