
Surveys often undercount commuters. Model commutes from postcodes, sites and shifts, then run short surveys to validate assumptions.

If your employee commute survey gets only 20% to 23% responses, it is a weak base for shuttle plans, parking estimates, and Scope 3 Category 7 numbers. You should start with commute modelling from employee postcodes, site locations, and shift data, then use a short survey only to check a few assumptions.
Here’s the short version:
What to do instead:
| Approach | Main input | Main problem | Best use |
|---|---|---|---|
| Survey-first | Employee answers | Low response, bias, reporting errors | Follow-up questions |
| Model-first | Postcodes, sites, shifts | Needs setup and assumptions | Baseline for planning and reporting |
In other words: You shouldn’t use a survey as the main source of truth. You should use it as a small add-on to a model built from data you already have.
Employee commute surveys sound useful on paper. In practice, low response rates and skewed samples often make the results shaky.
Typical response rates for employee commute surveys sit between 20% and 23% [1]. That’s a problem straight away. People who are less likely to answer voluntary surveys, including employees who drive every day, are often missing from the data [5].
Once that group drops out, the whole picture starts to lean the wrong way. Shuttle sizing, parking plans, and Scope 3 Category 7 estimates can all end up based on an incomplete sample. In many cases, the data makes green travel modes look more common than they are and drivers look less common than they are [5]. That hidden bias then feeds into every later decision [3].
Even when employees do reply, self-reported commute data comes with its own mess. People round distances, forget how often they travelled a certain way, and often over-report cycling or public transport use. Usually, that comes from memory errors rather than dishonesty, mixed with social desirability bias [5].
Multi-mode trips add another layer of confusion. Someone might drive to a station, take the train, then walk to the office. But in a survey, that journey often gets logged as just car or public transport. The detail that would help with a shuttle plan or parking decision gets lost [3].
Survey-only data is also hard to stand behind in finance reviews or Scope 3 Category 7 reporting. For survey data to be extrapolated with statistical reliability, a response rate of at least 60% to 70% is generally seen as the minimum threshold [2]. Most employer surveys don’t get close.
As one assessment of common reporting failures put it:
"When auditors ask 'How do you know your commute emissions decreased?', most companies have no answer. Just survey data with 20% response rates... That's not measurement. That's guesswork with footnotes." - The Fleet Team, Fleet [1]
This isn’t some small reporting detail. It affects planning, reporting, and how much faith people can put in the numbers.
The answer is not a longer survey. It’s commute modelling built from minimal data, such as postal codes, site data, and shift patterns. That’s why the next step is to model commutes instead of leaning only on survey responses.
The main risk isn’t just weak data. It’s the weak shuttle, parking, and Scope 3 Category 7 decisions that follow from it. If your input data is thin or off, your spend, emissions figures, and capacity plans get pulled off course too. That gets even harder when one sample is used across sites that work in very different ways.
A survey from one site rarely transfers cleanly to another site with different shifts, travel distances, and transport choices. Add hybrid workers into the mix, and you also need to split office days from home days the right way. If you don’t, you can end up double-counting or under-counting emissions [3]. Once you apply one site’s survey results to another, that mismatch carries through every estimate that comes after it [3].
Shift timing makes the problem worse. An early start can take regional rail off the table, while a later start opens more choices. If a survey doesn’t reflect shift patterns, shuttle demand and public transport use start from the wrong baseline [4]. At that stage, survey data stops being a firm planning input and becomes just an approximation.
Standard survey questions usually ask how someone commutes, not why or under which conditions. That leaves out details that matter in practice, such as car occupancy, vehicle size, fuel type, and seasonal variation. Without occupancy data, every employee in a carpool gets treated like a solo driver. That inflates both emissions and parking demand [3]. And if you don’t have actual commuting patterns, you can’t check what happened on a given day [1].
Scope 3 Category 7 relies on commute data that usually sits with employees, not in a system of record. That gap is why a modelled commute baseline is needed instead of a single annual survey.
This is general information, not legal or tax advice.
Don’t guess. Build the commute baseline from data you already have. The next step is modelling.
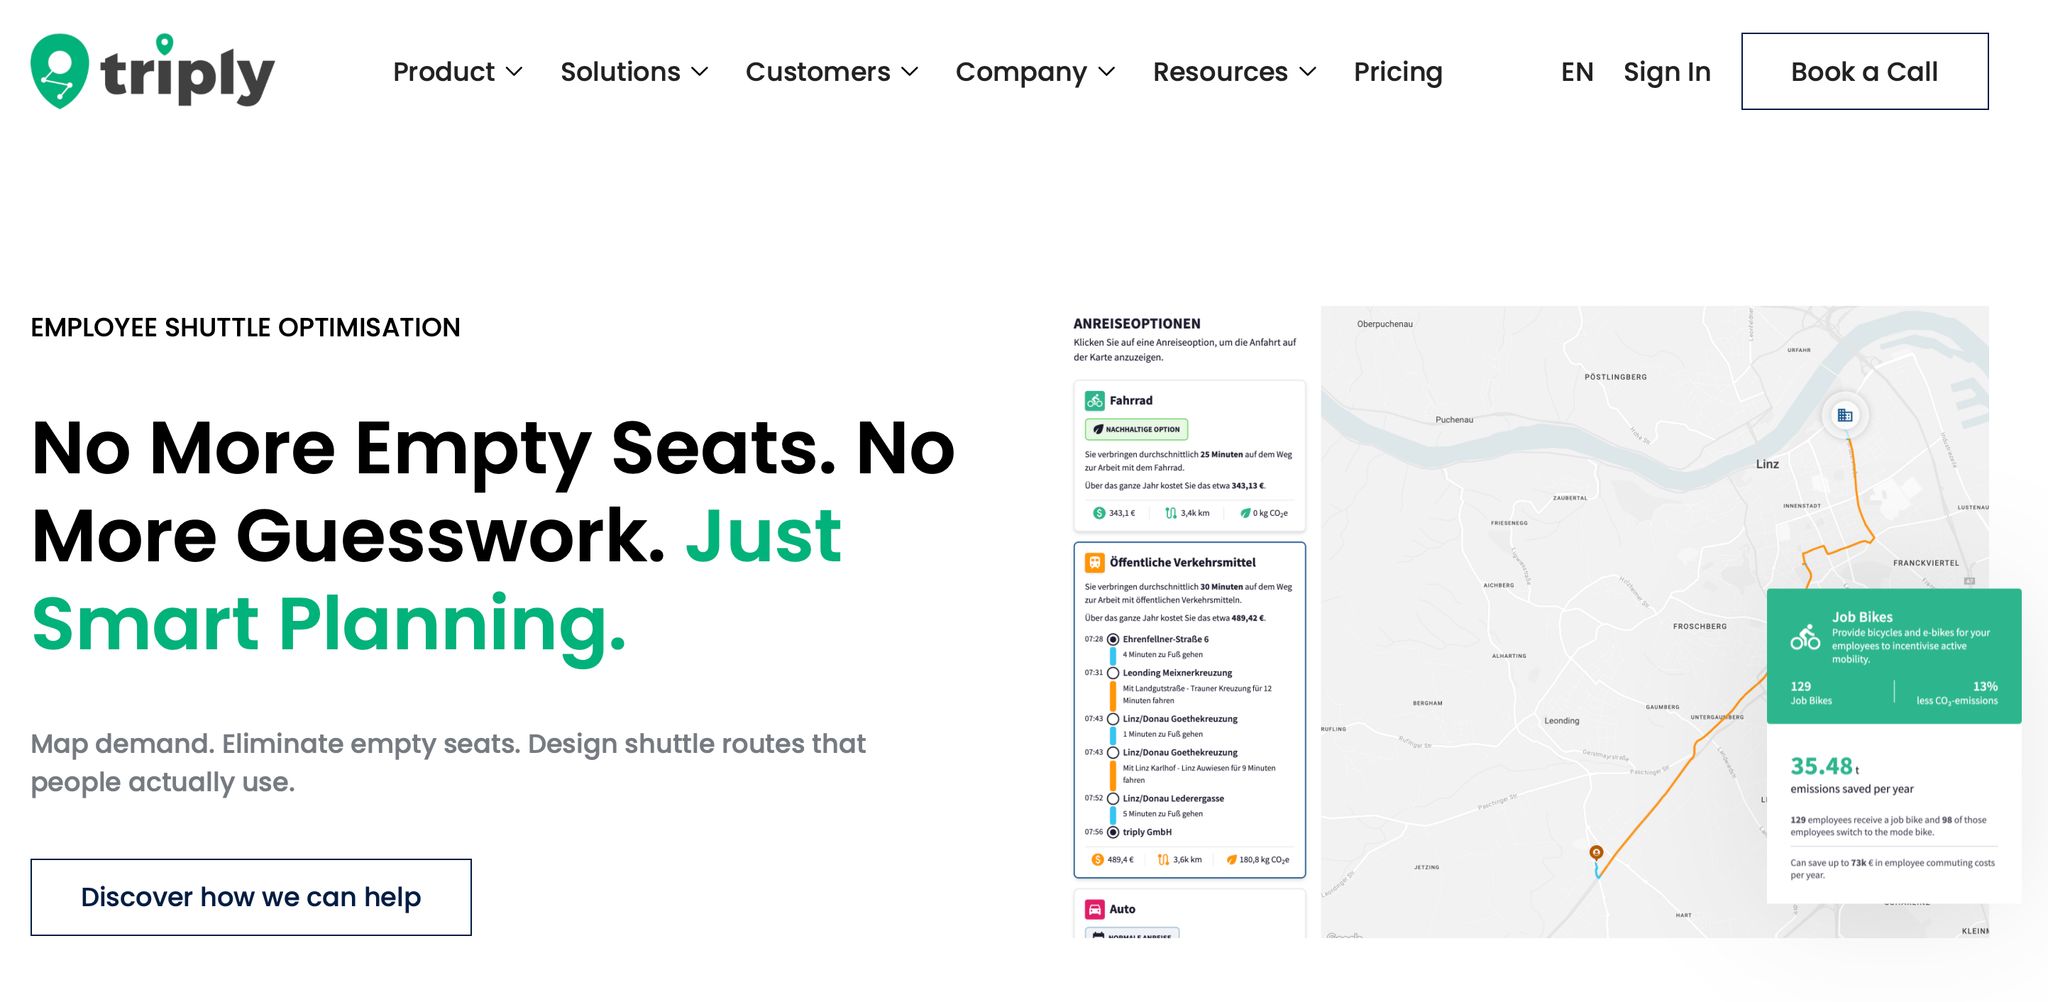
You can use records already sitting in HR, Finance, and Operations to model commute patterns across sites and shifts. With triply, the commute picture comes from inputs your teams already hold: employee postcodes (PLZ), site locations, and shift schedules. From there, it calculates the distance between each employee’s home postcode and work site, then maps likely travel modes across car, public transport, company shuttles, cycling, and walking.
The output is a site-by-site commute model based on internal records. That means it is much less exposed to non-response and social-desirability issues, which often make survey data hard to defend.
Keep commute data and homeworking data apart: the first is transport data, the second is energy data. For hybrid workforces, office days and home days should be split so they add up exactly to contracted working days. That helps avoid double-counting in Scope 3 Category 7 reporting [3].
Once the baseline is in place, it becomes something teams can use day to day.
A commute model built this way gives you outputs you can act on. For shuttle planning, triply can simulate proposed routes and estimate cost, uptake, and emissions impact before you commit budget. For parking, it shows how demand changes by site and shift. For Scope 3 Category 7 reporting under CSRD and ESRS E1, it gives you a documented, auditable basis that does not rely on survey response rates that are often only around 20% to 23% [1].
Car occupancy is treated directly. Since car emission factors apply per vehicle-kilometre, a carpool with three employees does not create three times the emissions of one driver [3]. That matters more than many teams first expect. The model avoids overstating both emissions and parking demand by using occupancy assumptions that you can check and adjust.
See the employee shuttle optimisation use case for route and capacity planning.
Surveys still have a place, but only after the model is set up. Modelling answers the hard numbers: how many employees are travelling, how far, by which mode, and with what cost and emissions. What it can’t tell you is why someone drives instead of taking the shuttle, or whether they would use a new cycling subsidy.
That’s where a short, targeted survey still helps. Not as the main dataset, but as a qualitative layer on top of the model. A small set of questions can:
Use a short survey to test assumptions and explain outliers, not to build the baseline.
This is general information, not legal or tax advice.
An employee commute survey can seem like the obvious place to start. But in practice, it often gives you only part of the picture: response rates usually land around 20% to 23%, non-response bias can skew the results, and auditors may challenge the data during finance reviews and Scope 3 Category 7 reporting [1][3]. The main issue isn't whether you collected enough survey responses. It's whether you can stand behind the numbers used to make decisions.
A better route is to build your baseline from data you already have. Use employee headcount, postal codes, worksite locations, and shift schedules to model commute distances, modal split, and emissions across your workforce [3]. And keep commuting days and homeworking days clearly separated, so your Scope 3 Category 7 inventory stays defensible.
That gives finance, sustainability, and operations one traceable dataset. From there, you can test measures before spending budget.
For shuttle planning, see triply's employee shuttle optimisation use case for route and capacity planning. Book a demo to see what commute modelling before investment would look like for your organisation. The remaining implementation details are covered in the FAQ below.
This is general information, not legal or tax advice.



