
Raw commute data won't settle shuttle, subsidy or emissions choices. Model PLZ, shifts, sites, modes and costs to test measures.

To decide whether a shuttle, ÖPNV subsidy, carpooling offer, or shift change makes sense, you need one thing first: a clean commute model.
This article’s core point is simple: raw commute data does not help much on its own. You need to connect PLZ data, shift times, site locations, travel modes, and transport costs in one model to answer basic business questions such as:
In practice, that means turning scattered inputs into a small set of decision metrics:
For large employers in Germany, this matters most when there are many plants, rotating shifts, and mixed commute modes. A spreadsheet may work for one site. It often breaks once I compare sites, shifts, and measures side by side.
Here’s the short version:
A few examples make the value clear:
So the article is not just about software. It is about using commute data to make route, site, finance, and reporting decisions with one shared logic.
Below, we walk you through how that model works, which metrics matter most, and how you can test mobility measures before spending €50.000, €100.000, or more on a service that may not match demand.
Employee commute software brings HR data, site details, shift plans, commute modes, and transport costs into one commute model. That gives you a single view of patterns, cost, and reporting impact. It also helps with mobility planning, cost control, and Scope 3 Category 7 emissions decisions across several sites and shift setups.
On its own, raw data only tells part of the story.
PLZ data can show where people live. But that still doesn’t tell you whether demand is usable for planning. For that, you also need shift timing and site location. Those two pieces show when people need to travel and where they need to go. That’s what turns a pile of inputs into outputs you can measure.
The model uses PLZ, site locations, shift schedules, commute modes, and transport costs to show three simple things:
That gives you one basis for site, route, and mobility decisions.
Spreadsheets may work for a single site with a simple setup. But once you’re dealing with multiple plants and rotating shifts, they start to fall apart.
They can’t hold one consistent, live commute model across all locations and shift systems. And without that live model, site-to-site comparisons become shaky. The same goes for shift comparisons and for checking whether a mobility measure is doing what you hoped.
Once the model is set up in a structured way, you can turn it into metrics you can act on, including load factor, cost per boarded rider, and Scope 3 Category 7.
Once the model is set up, employee commute software turns raw commute data into metrics you can use. It connects PLZ data, shift times, sites, transport modes, and costs to day-to-day decisions on routes, subsidies, and service levels.
It starts with geocoding. The software converts PLZ data into coordinates and maps employees to each site. Then origin-destination analysis groups employees by where they start, where they need to go, and when they need to travel. That turns home-to-site data into inputs for route and service planning.
Next, the software estimates travel time and distance by mode: car, public transport (ÖPNV, local public transport), or shuttle. That gives you the basis for the metrics below. If you manage more than one site, the software pulls demand into one view. You can see where peaks appear, where demand gathers, and which routes can support a service.

Three core metrics and one supporting output do most of the heavy lifting:
| Metric | Key input data | Decision supported |
|---|---|---|
| Load factor | Shift times, route ridership, vehicle capacity | Route sizing, timetable adjustment, service continuation |
| Cost per boarded rider | Operating costs, boarded riders per route | Budget approval, cost-per-site comparison, subsidy review |
| Scope 3 Category 7 | Commute mode, employee distance, emission factors | ESG reporting, emissions reduction target-setting |
| Demand cluster size | PLZ, site location, shift schedule | New route design, stop placement, multi-site consolidation |
Use these outputs to back changes, support budget requests, or flag services that no longer match demand. That’s what makes it possible to test mobility measures before you commit spend.
Once you know load factor, cost per boarded rider, and Scope 3 Category 7, you can test mobility measures before you sign a contract or approve a budget. That gives you a clean way to compare shuttles, incentives, carpooling, and shift changes on the same data basis.
Each mobility measure answers a different planning question.
Employee shuttles only make sense if you can group enough employees into a route that fills seats on a steady basis. If utilisation is low, the case gets weaker on cost per boarded rider. Commute data helps you check whether a proposed route can hit a workable load factor under actual shift patterns before you book a vehicle. From there, you can use the same model to see how other measures perform under those same shift patterns.
ÖPNV, meaning local public transport, incentives such as subsidised monthly tickets or top-up allowances bring up a different issue: who is likely to use them, and what will that cost per person? You can model uptake and cost against employee location and commute patterns before you lock in the budget.
Carpooling tends to work best when employees with overlapping shifts live in the same area. Demand clusters show whether there are enough overlapping employees to support a carpooling programme.
Shift-time adjustments affect everything else. Move a shift start time, and you may change whether a shuttle fills, whether ÖPNV connections still line up, and which employees can carpool in practice. Commute modelling shows the effect on every measure at the same time, so shift changes become a test variable instead of an afterthought.
When one assumption changes, the effect runs through all other measures. Pre-investment simulation puts every scenario through one consistent commute model, so you're comparing like with like.
triply is built for this stage: before you invest. You can test a proposed shuttle route against PLZ distribution and shift data, model the uptake and cost impact of an ÖPNV subsidy, or check whether a schedule change strengthens or weakens the case for a mobility measure. The output gives you decision inputs you can take straight into a budget discussion.
That matters even more for multi-site employers, where a decision at one plant can change demand at another. One consistent model across all sites means finance, sustainability, and operations teams are working from the same picture.
The table below maps each measure to the metric that drives the decision.
| Mobility measure | Key metrics used | Decision supported | triply use case |
|---|---|---|---|
| Employee shuttle | Load factor, cost per boarded rider | Route approval, vehicle sizing, service continuation | Models demand from PLZ and shift data before the route is contracted |
| ÖPNV incentive | Cost per boarded rider, Scope 3 Category 7 | Subsidy level, eligible employee groups, emissions impact | Estimates uptake and cost from commute patterns and location data |
| Carpooling programme | Demand cluster size, Scope 3 Category 7 | Programme scope, matching logic, emissions reduction potential | Identifies viable clusters from home location and shift overlap |
| Shift-time adjustment | Load factor, demand cluster size | Timetable changes, impact on active and planned measures | Shows how a timing change affects every measure in the same model |
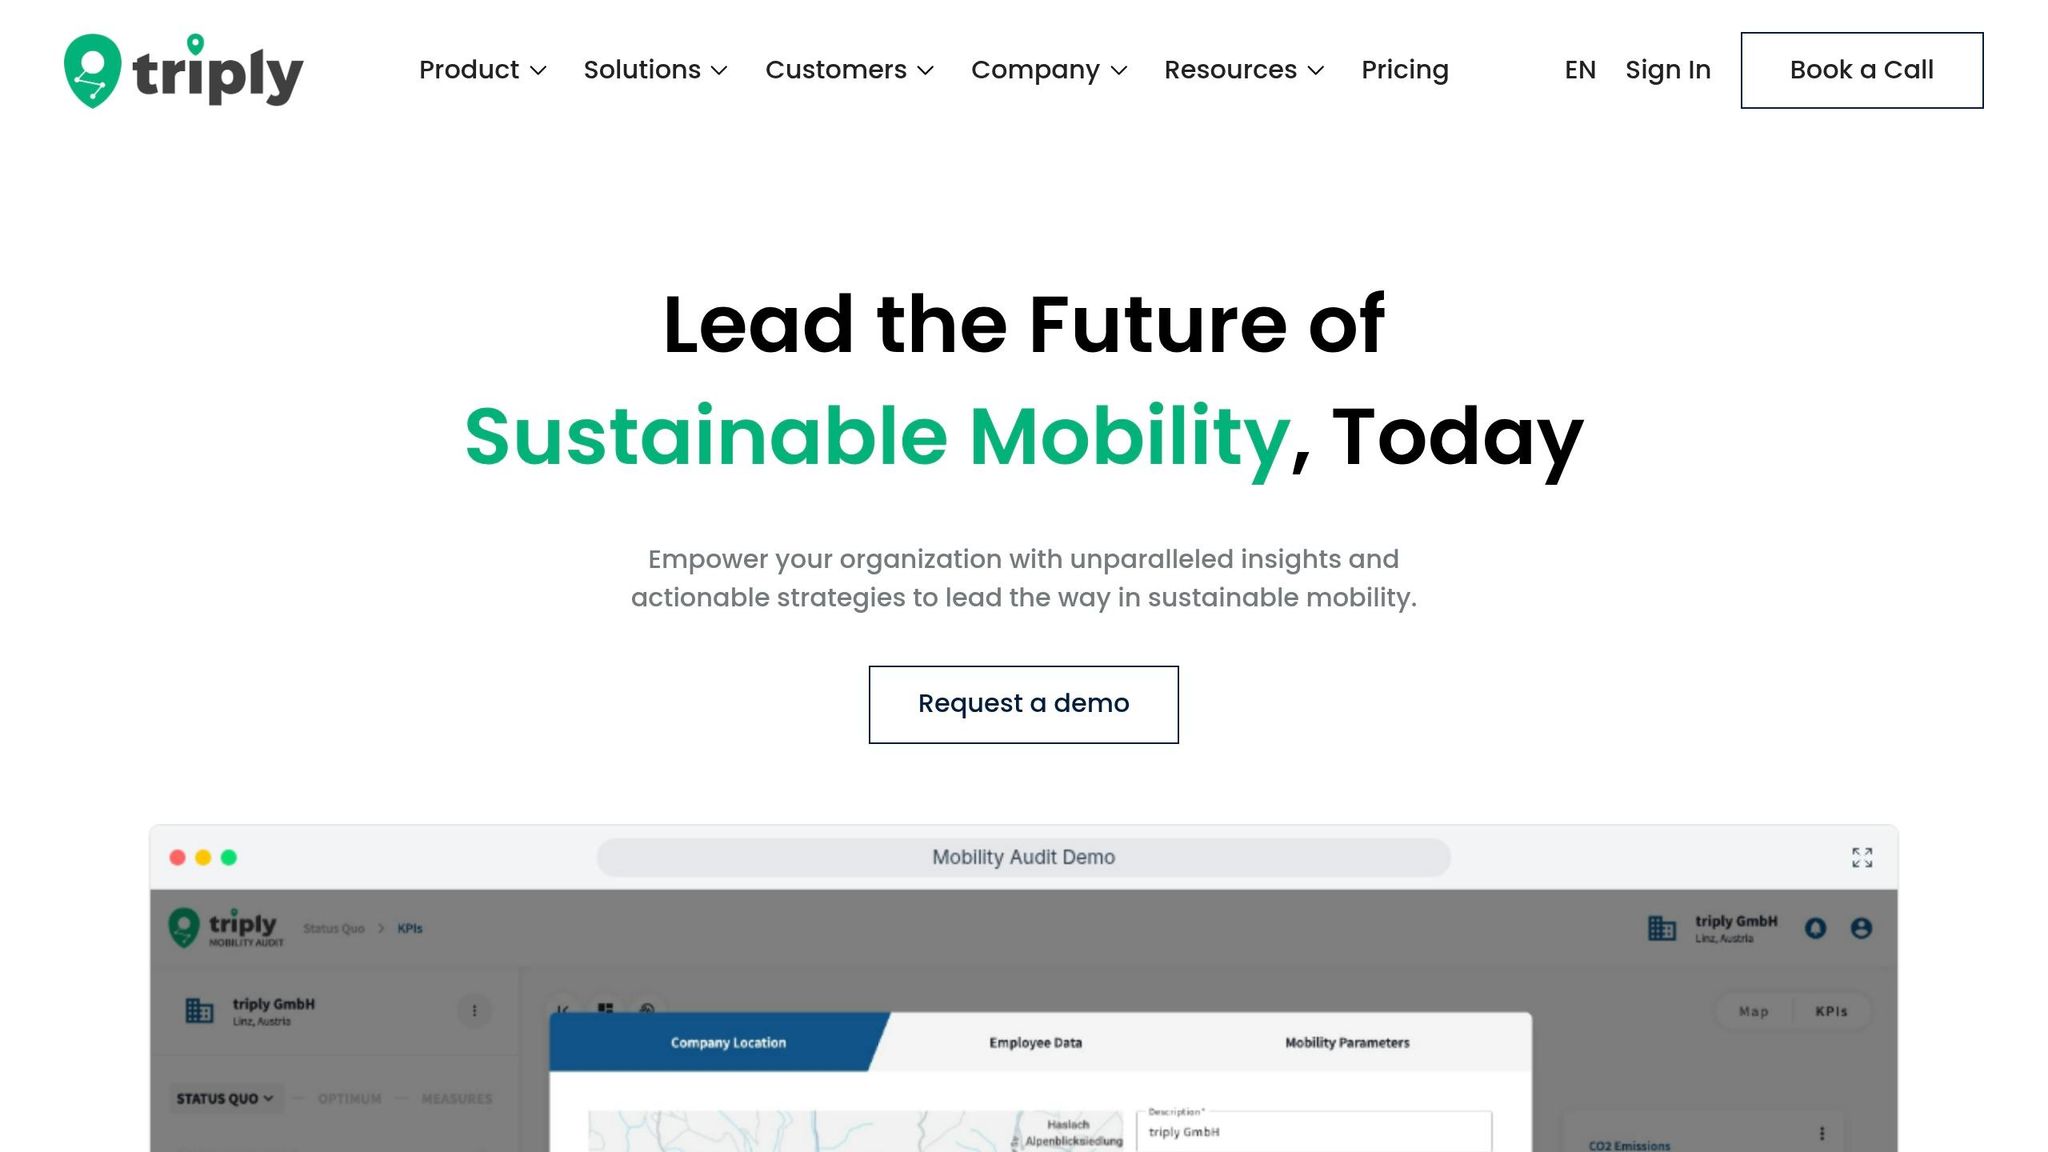
Good employee commute software starts with the data you already have: PLZ, shifts, and site locations. From there, it should model demand across many sites and shift patterns without clunky manual fixes.
It also needs to map local public transport links with care. If that part is off, commute estimates won't match what people can actually do day to day. And from a privacy point of view, the model should work with as little HR data as possible. That matters because the quality of the model shapes every later decision on cost, emissions, and service planning.
The output also has to work for more than one team. Finance needs cost figures. Sustainability needs Scope 3 Category 7 data. Operations needs demand and load factor. When all three teams use the same commute model, you get one shared view instead of a mess of spreadsheets and siloed reports.
triply is built around that logic. It turns minimal HR data into a multi-site commute model, brings demand across plants into one comparable view, and runs pre-investment simulations.
That includes proposed shuttle routes via employee shuttle optimisation, ÖPNV incentives, and shift-time changes. So before any budget is committed, you can see the likely impact on cost, load factor, and Scope 3 Category 7.
It also produces audit-ready reporting aligned with CSRD and ESRS E1.
Raw commute data on its own doesn't tell you if a shuttle route will work, if a public transport incentive will actually get used, or what your Scope 3 Category 7 footprint is. The right employee commute software turns that raw input into metrics you can act on, like load factor, cost per boarded rider, and emissions.
Pre-investment simulation means you test before you spend, not after.
Book a demo to see how triply models your commute data.



