
Build one cross-site commute model to compare plants, reveal shared demand, test measures, and align Scope 3 Category 7 reporting.
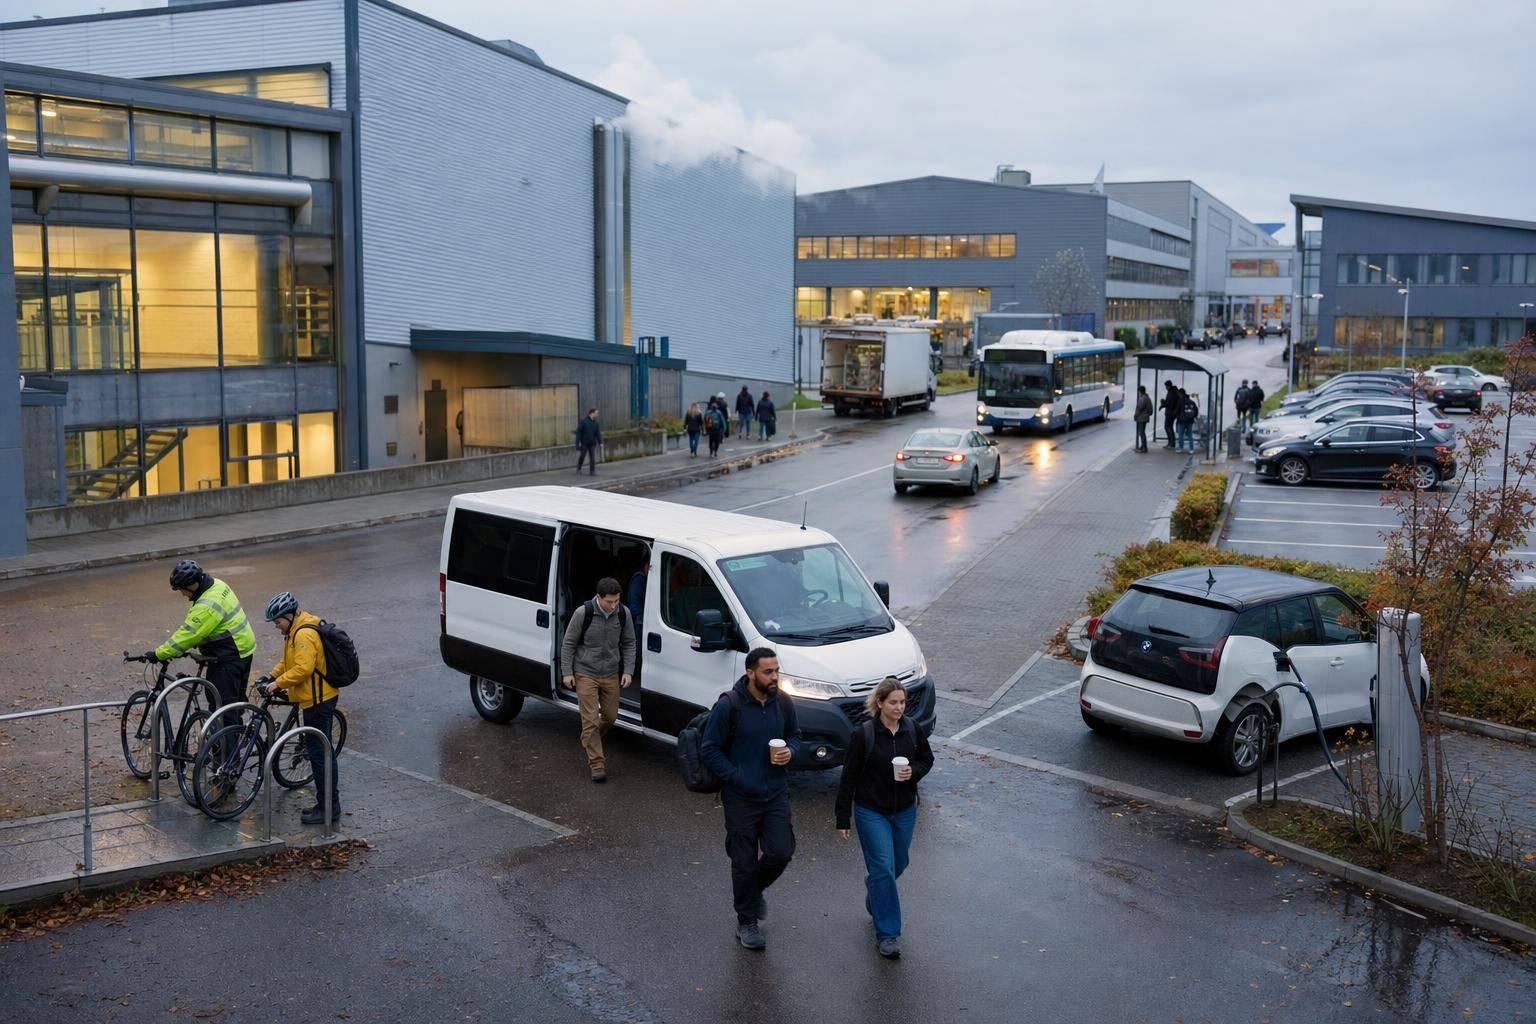
If you run several plants, do not plan commuting site by site. Build one model for all sites first.
We’d sum it up like this: when each plant uses its own files, cost logic, and emissions inputs, comparisons break fast. One shared model fixes that by putting PLZ data, shift patterns, route options, cost per rider, and Scope 3 Category 7 figures on the same basis.
Here’s the short version:
A few facts stand out:
| Topic | Plant-by-plant view | One cross-site model |
|---|---|---|
| Data | Split across files | Shared structure |
| Catchments | Hard to spot overlap | Overlap is visible |
| Cost checks | Site-only | Comparable across plants |
| Scope 3 Cat. 7 | Separate inputs | Same basis across sites |
| Measure testing | Local only | Network-level simulation |
Our take: if you manage commuting for more than one plant in Germany, the first job is not launching a shuttle. It is building one clean baseline for cost, access, and emissions so every team works from the same numbers.
That is the core idea behind the article below.
Once the inputs are standardised, the next step is simple in theory: turn each plant into one commute model you can compare across sites. The starting point is usually postal codes (PLZ, Postleitzahl) and shift patterns. From there, Triply Consolidate can model commuting across all plants without running a full employee survey.
In practice, each plant tends to export data a bit differently. One file may use different column names, another may group shifts in its own way, and a third may structure postal code fields differently.
Before any site-to-site comparison makes sense, those exports need to be brought into one shared schema. Once that step is done, you can compare plants on the same basis instead of juggling separate files and site-specific assumptions.
The model should use actual home locations against real road and public transport networks, not rough averages. In Germany, that means factoring in ÖPNV, S-Bahn, U-Bahn, and Regionalbahn where they matter.
That detail changes the picture a lot. A plant located near an S-Bahn corridor will usually show a very different commute pattern from a plant where most people rely on cars.
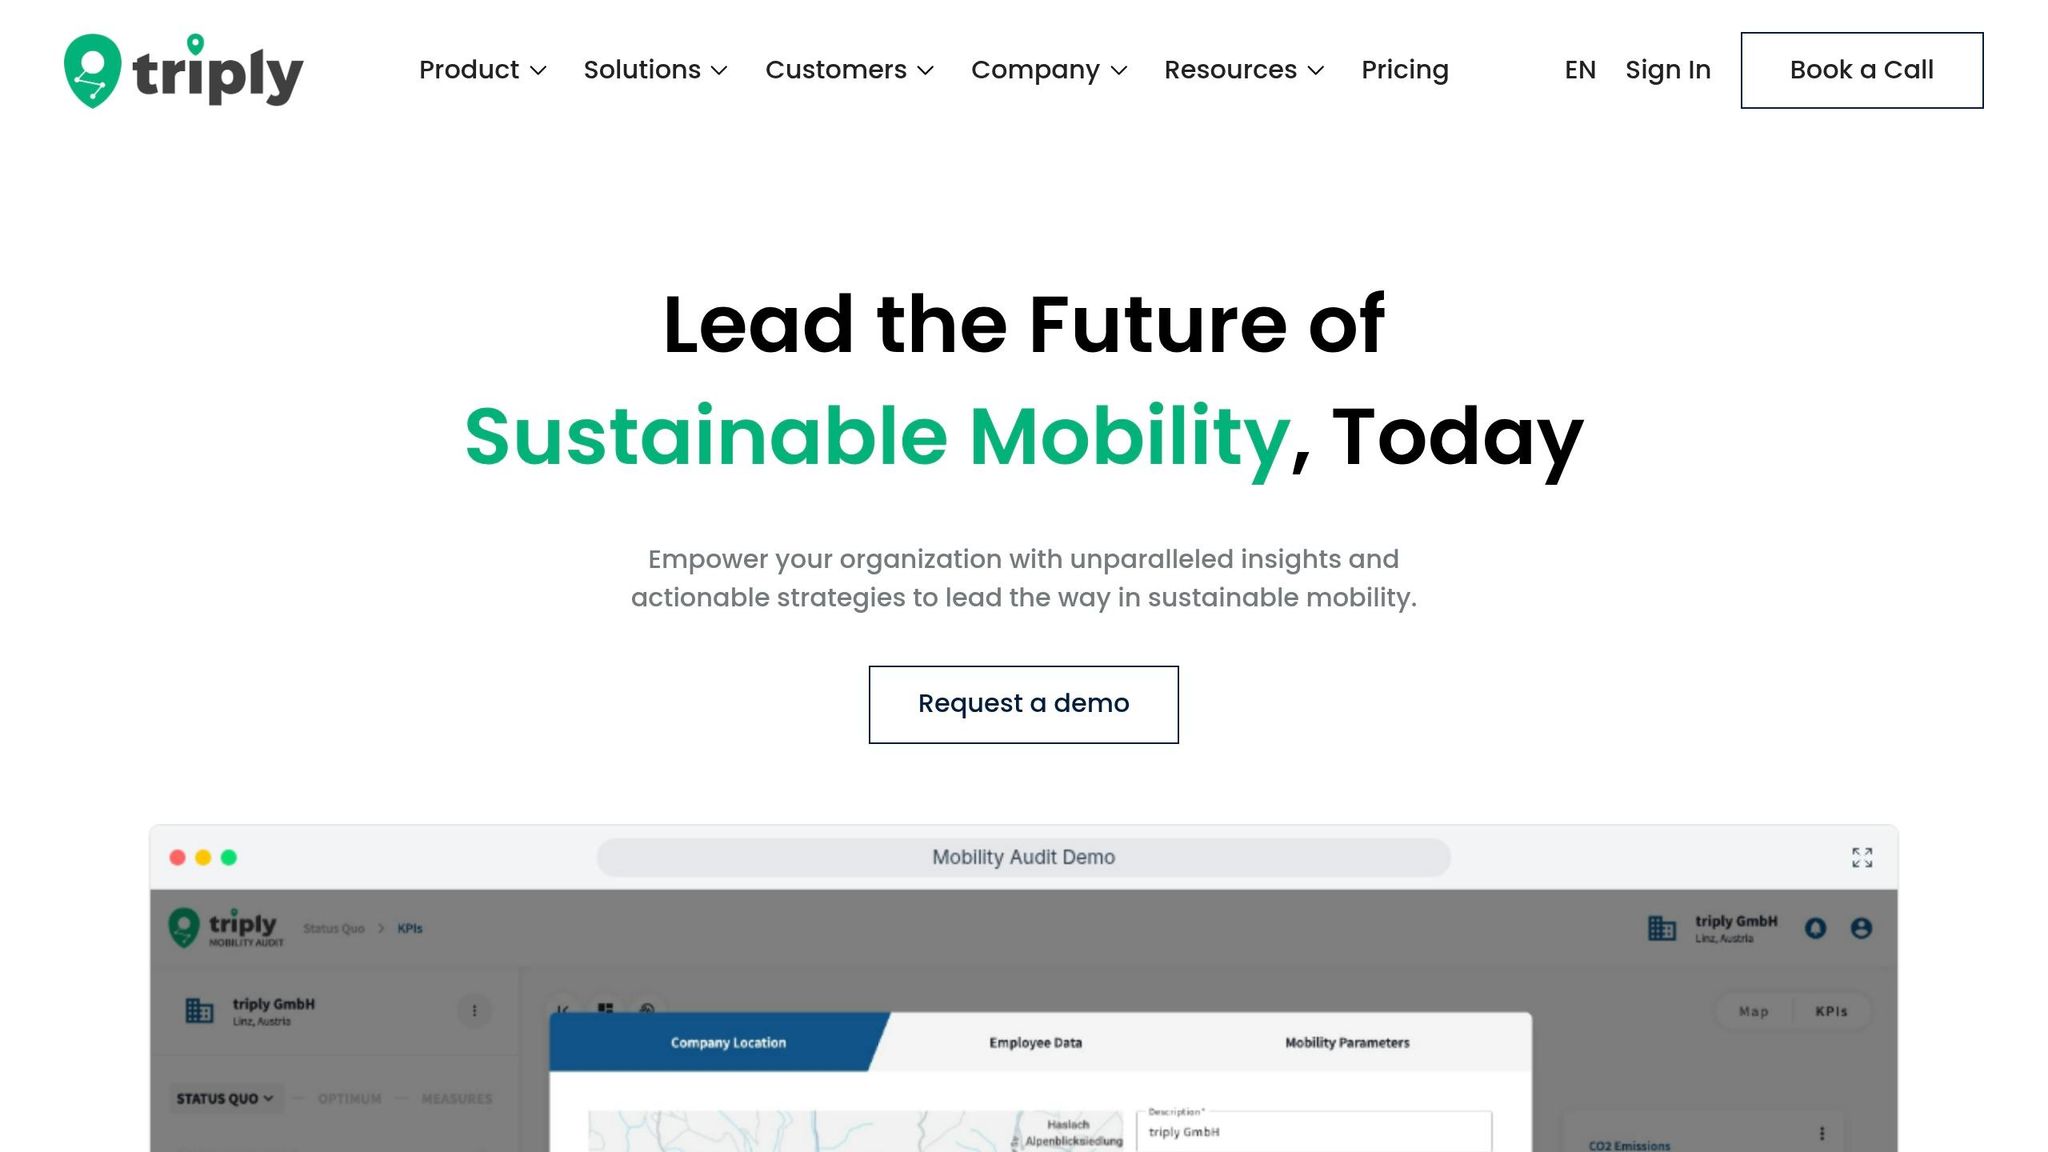
Once each plant is mapped against real networks, triply Consolidate brings those site views together into one baseline. That gives finance, HR, operations, and sustainability one shared set of numbers before any measure is tested.
From there, teams can compare sites, spot patterns, and run scenario simulations. That baseline then becomes the input for the KPI comparisons in the next section.
Once you have a cross-site baseline, the next step is simple: pick the metrics that let you compare plants on the same basis.
You don’t need a long list. In practice, only a few metrics help you compare plants fairly and decide what to do across the full network. Those are the numbers that help you compare sites, test measures, and spot when one network-wide action makes more sense than a set of separate site fixes.
With one consolidated model, you can use the same assumptions across plants and focus on the outputs that matter most. Those outputs show where a measure fits, where people are likely to use it, and where it can have the biggest effect.
| Metric | Decision use |
|---|---|
| Cost per boarded rider | Whether a measure is worth funding across multiple sites |
| Expected use at that site | Whether employees are likely to use the measure given local constraints |
| Scope 3 Category 7 impact | Where you can cut employee commuting emissions most effectively |
Consistency is what makes plant-to-plant comparison valid. If each site uses different assumptions, the comparison falls apart. Use the same assumptions at every plant so you can rank sites, compare measures, and avoid local fixes that won’t scale.

Use the same model for reporting and decision-making so Scope 3 Category 7 reflects the same assumptions your operations team uses. That gives teams one shared baseline for both reporting and action.
Then use those KPIs to decide which measures should be optimised across the whole network, not site by site.
Most multi-site employers begin with plant-by-plant decisions. That’s normal. Each site has its own team, its own pressure points, and its own budget discussions.
But a network-wide model changes the picture. It shows where one measure can support more than one plant instead of treating every site as a separate case.
Overlapping catchments and shared demand often stretch across multiple sites. One network model makes those overlaps visible. Then local fixes stay where they actually make sense for the site, not just where they’re easiest to approve.
Once shared demand is visible, you can test which measures cover more than one site instead of solving the same problem again and again.
With a consolidated baseline in place, the next step is deciding which measures should get budget. That is where triply Simulate comes in.
Before any money is committed, triply Simulate models shuttles, public transport incentives, carpooling, and schedule changes against real commute data. It compares total cost, expected load factor, cost per boarded rider, and Scope 3 Category 7 impact across the network.
That gives finance, operations, and sustainability teams one shared view before investment decisions are made.
The table below shows the practical difference for finance, operations, and sustainability.
| Decision criterion | Plant-by-plant approach | Network-wide model |
|---|---|---|
| Data consistency | Separate assumptions at each site | One consistent data basis |
| Shared demand across sites | Hard to see | Visible across plants |
| Cost per boarded rider | Hard to compare reliably | Comparable across the network |
| Scope 3 Category 7 impact | Evaluated site by site | Evaluated on the same basis |
| Pre-investment testing | Limited to local cases | Simulate across sites before investment |
That same shared basis then carries into the final cost, operations, and emissions decision.
Managing commute decisions plant by plant creates blind spots. Data ends up inconsistent, shared demand stays hidden, and cost comparisons start to fall apart. A single consolidated model fixes that. It gives every stakeholder the same view of the network.
With one baseline in place, you can use it across modelling, simulation, and reporting. triply's workflow is straightforward: Analyse builds the model, Consolidate creates one baseline, Simulate tests measures, and Report turns that same data into Scope 3 Category 7 output for CSRD and ESRS E1.
Each stakeholder uses the same baseline in a different way. But the upside is simple: one shared model gives each team the numbers it needs, without everyone working from different assumptions.
Operations gets a workable network view instead of disconnected site reports. Shared demand across plants becomes visible, which makes it easier to allocate resources across sites.
Finance gets defensible cost logic. Cost per boarded rider and load factor are calculated on the same basis at every site, which supports budget decisions.
Sustainability gets a clear, consistent Scope 3 Category 7 baseline. Because the commute model and the emissions output come from the same data, you avoid the usual scramble to reconcile separate calculations at reporting time.
HR gets a better view of employee access constraints. The model shows which groups face the longest and least accessible commutes when you review shift patterns or plan site changes.
If your organisation manages commutes across more than one plant and still works site by site, start with a consolidated baseline. Book a demo with triply's multi-site commute optimization model to review your multi-site commute baseline and scenarios.



