
Align finance and sustainability with one commute data set for consistent cost and Scope 3 Category 7 emissions reporting.

One employee commute should not produce two different answers. If finance and sustainability use separate files, methods, and assumptions, the same trip can lead to different cost and Scope 3 Category 7 figures.
Here’s the short version:
In many firms, HR, plant teams, finance, and sustainability each hold part of the same picture. That often leads to duplicate work, uneven site comparisons, and weak decision support. A shared data set fixes the split at the source.
Quick comparison
| Topic | Separate commute files | One shared commute data set |
|---|---|---|
| Cost and emissions baseline | Different | Same |
| Assumptions | Set by team | Set once |
| Site comparison | Hard to line up | Easier to compare |
| Pre-spend modelling | Split across files | Done in one model |
| Audit trail | Harder to trace | Clearer to trace |
At large industrial sites, commute data rarely sits in one place. HR has employee postal codes. Operations tracks shift patterns and shuttle use. Sustainability keeps its own reporting assumptions. What you get is a patchwork of spreadsheets, survey exports, and reporting files. And once those inputs are split across separate files, each team starts from a different baseline.
When each department works from its own slice of data, operations, HR, finance, and sustainability end up with different versions of the same commute. So the same journey can lead to different cost figures and different emissions figures.
Finance might model the commute as cost per boarded rider. Sustainability might look at that same commute through transport mode, distance, and trip frequency. Those methods are not interchangeable. Add different rules by plant, shift, or employee group, and site-level figures become hard to line up. In plain terms: you can't compare sites on equal terms.
One shared model is the better way to work. Put simply: finance and sustainability should use the same commute model, with the same inputs, assumptions, and outputs.

Every commute starts with the same core details: origin area, destination site, and the commute rules you set once.
When those assumptions live in one place, finance and sustainability stop building separate versions of the same commute picture. The same data set can support both cost analysis and Scope 3 Category 7 (Employee Commuting) reporting. It also makes audit work easier. You can show which journey attributes were observed, which were derived, and how those attributes feed into cost or emissions results.
This is where the difference becomes clear in day-to-day work. Teams aren't arguing over whose spreadsheet is right. They're working from the same model.
| Separate data sets | One shared data set | |
|---|---|---|
| Consistency | Different assumptions can produce different answers for the same workforce | The same origin area and destination site inputs support both cost and emissions analysis |
| Auditability | It is harder to see which inputs were directly observed and which were derived | You can trace each result back to the shared journey attributes |
| Decision support | Site-level discussions can start from different data views | Everyone works from the same model and the same assumptions |
That makes site decisions easier to defend.
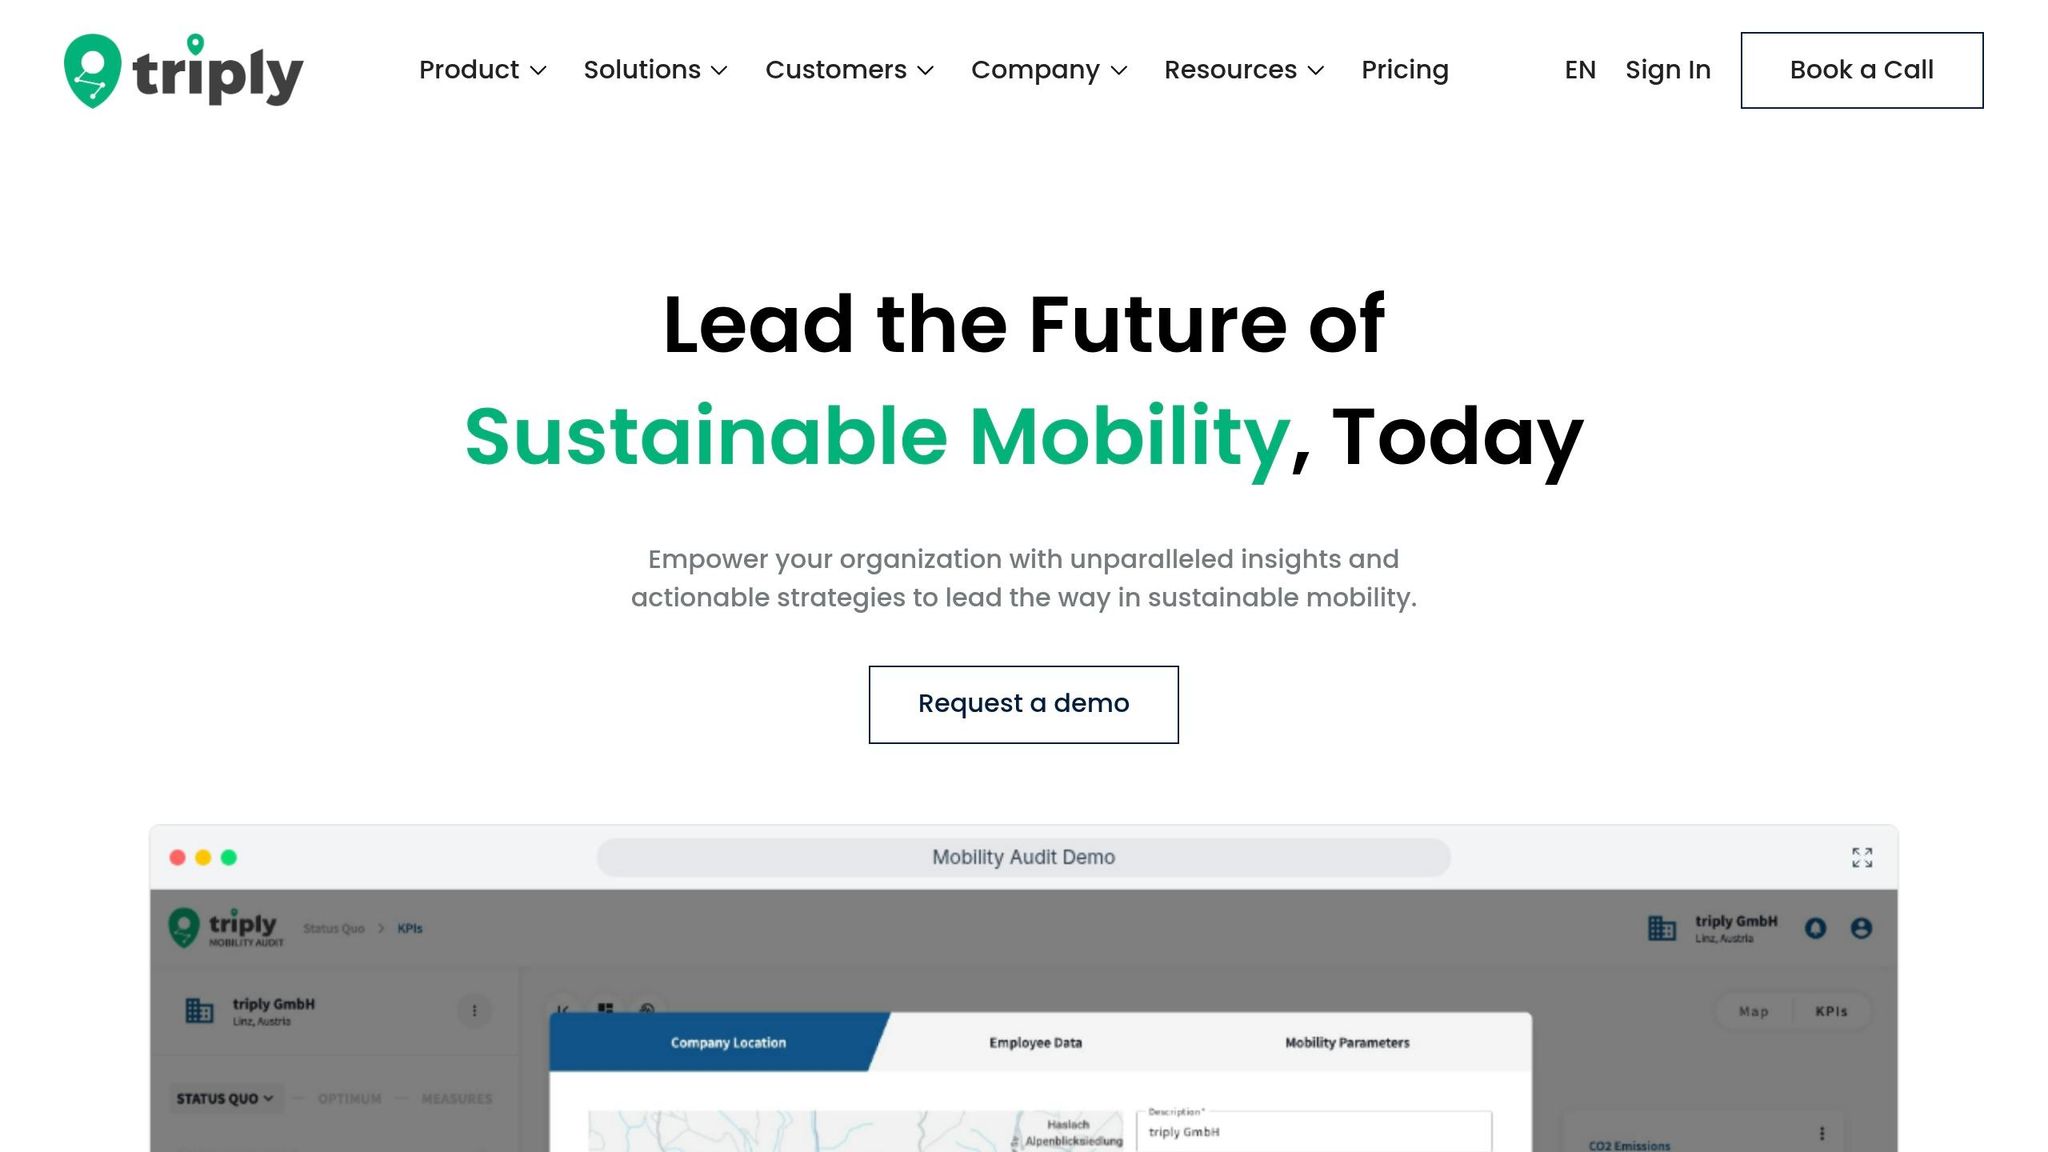
With triply, you create one commute data set from a small set of inputs, then use that same data for cost analysis and Scope 3 Category 7 reporting. Here’s how that shared data set comes together in triply.
triply models day-to-day commuting from a compact group of inputs: employee postal codes, site locations, and shift patterns. From there, Consolidate brings multiple plants into one consistent data set. That means you can compare results by site or by shift without rebuilding the model each time.
Once your data set is consolidated, you can test measures before any budget is approved. You can simulate shuttles, public transport incentives, carpooling, and schedule changes before you spend, then reuse that same model for Scope 3 Category 7 reporting.
The key point is simple: the same commute data and the same assumptions feed both cost and emissions output. That gives teams audit-ready results for CSRD and ESRS E1 reporting.
| Capability | Finance and operations use case | Sustainability use case |
|---|---|---|
| Analyse | Model commute cost drivers by site and shift without large-scale surveys | Establish the journey data needed for a Scope 3 Category 7 baseline |
| Consolidate | Bring multiple plants into one cost view with consistent assumptions | Keep all sites on the same emissions methodology |
| Simulate | Test shuttle routes, transport incentives, or schedule changes before budget approval | Project emissions impact before implementation |
| Report | Share site-level cost and uptake projections with operations leads | Produce audit-ready Scope 3 Category 7 output for CSRD and ESRS E1 reporting |
Book a demo to see how one commute data set supports cost and emissions decisions. This is general information, not legal or tax advice.
That’s why one shared commute data set is the right starting point for both cost and emissions decisions. If finance and sustainability each keep their own commute data, the same trip can end up being counted in different ways. That leads to mismatched figures and extra reporting work nobody wants. A single shared commute data set fixes that at the source.
If you’re weighing up whether to consolidate, four practical gains stand out.
triply helps you analyse, consolidate, simulate, and report from one commute data set. Book a demo to see how one commute data set can support both your cost and emissions decisions.



