
Frame shuttles as site-capacity investments: compare full shuttle cost vs avoided parking, model CO2 and retention, and pilot for 60–90 days.

An employee shuttle only makes sense if one model answers four things at once: cost, parking relief, commuting CO2, and retention. If you keep those numbers on the same assumption set, the approval call gets much simpler.
Here’s the short version:
Shuttle should not be pitched as “transport”. We’d pitch it as a way to deal with parking cost, site limits, commute emissions, and staffing friction in one decision.
| Area | What we’d measure | Why it matters |
|---|---|---|
| Cost | Annual programme cost, cost per boarded rider | Shows whether uptake supports the spend |
| Parking | Stalls avoided, parking capex deferred, annual stall cost | Links the shuttle to site capacity and property cost |
| Carbon | Scope 3 Category 7 CO2e from shifted car trips | Helps with commuting emissions reporting |
| Retention | Commute-linked turnover, absence, hiring radius | Shows workforce effect beyond transport |
If we were building the approval deck, we’d keep it simple: one baseline, two scenarios, one stop rule, and one pilot plan.
A finance-ready employee shuttle business case is a structured document built on measured facts and clearly labelled assumptions.
Start with HRIS home postcode data, not self-reported surveys, and map it against shift start and end times. Then add your current parking capacity, utilisation rate, and annual cost per stall.
This baseline shows where demand is concentrated and which shifts or sites are hardest to serve. Just as important, it sets the factual inputs that shape route feasibility, load factor, and site constraints. Those are the three variables most likely to trigger approval risk.
Use this baseline to define the routes, vehicle size, and uptake case in your model.
Once the baseline is set, define the shuttle proposal in concrete terms: which origin areas it serves, what the timetable looks like, how it lines up with shift starts, what vehicle capacity you plan to use, and what load factor you expect once operations have matured.
Label uptake as modelled. Then show how cost per boarded rider changes if uptake comes in below plan. A sensitivity range is easier to trust than a single-point estimate.
Spell out how route design choices, vehicle size, and load factor assumptions affect cost per boarded rider, so finance can see the levers, not just the final total.
Finance doesn’t need the full model to judge the range of outcomes. It needs the key outputs across conservative and realistic scenarios.
| Metric | Conservative scenario | Realistic scenario |
|---|---|---|
| Annual shuttle programme cost | Modelled | Modelled |
| Cost per boarded rider | Modelled | Modelled |
| Parking stalls avoided | Measured from site data | Measured from site data |
| Scope 3 Category 7 reduction (CO2e) | Modelled | Modelled |
| Retention value | Modelled | Modelled |
This structure pushes every stakeholder to work from the same inputs and the same output range. Mark each row clearly as either a measured fact or a modelled assumption. That kind of clarity makes the case easier to trust.
Use this summary page to test cost, parking relief, and payback in the next section.
Start with the same route and uptake assumptions from the summary page. Then build the full cost model.
That means looking beyond the vendor invoice. Include the whole programme cost, split into:
It also helps to separate fixed costs from variable operating costs. Why? Because fixed costs don't disappear when adoption is weak. If fewer people board than planned, cost per boarded rider can climb fast.
Set a clear stop rule before launch. For example: if Year 1 adoption stays below 20%, stop or redesign the programme [1]. That makes the shuttle look like a managed investment, not an open-ended spend.
Once the cost picture is clear, the next step is simple: turn freed parking stalls into avoided parking spend.
Parking relief is often the number that gets attention. It links shuttle demand to avoided space, and that space has a clear price tag.
Put a value on freed stalls in two ways:
As of February 2026, the median construction cost for aboveground structured parking was $52,000 per space, while underground parking reached $73,000 per space [3]. On top of that, annual operating and maintenance costs add another $400 to $1,000+ per space for cleaning, security, lighting, and repairs [3].
So the comparison isn't just shuttle opex versus today's parking headaches. It's shuttle opex versus the 30-year cost of owning and operating parking [3].
A couple of examples make this concrete.
When Microsoft's Connector programme in Redmond removed approximately 800 vehicle trips per day, the company avoided building 800 parking stalls [3][1].
Genentech made the same calculation at its South San Francisco site, funding its 55-coach gRide fleet specifically by choosing not to construct a new parking structure [3].
At that point, shuttle planning stops being only a mobility issue. It becomes a site-capacity choice too.
A side-by-side scenario view makes the trade-offs easier to read. Use a conservative case and a realistic case.
| Scenario | Annual cost | Boarded riders/day | Load factor | Cost per boarded rider | Parking effect | Notes |
|---|---|---|---|---|---|---|
| Conservative | ~$400,000 [1][3] | 150 to 200 [1][3] | 40% to 50% [1][3] | ~$12 to $15 [1][3] | Defers expansion [1][3] | Low load; higher unit cost [1][3] |
| Realistic | ~$600,000 [1][3] | 350 to 400 [1][3] | 65% to 75% [1][3] | ~$6 to $9 [1][3] | Avoids expansion [1][3] | Mixed route design; large-site demand [1][3] |
If you want a payback lens, run the same assumptions through a 3-year scenario view [4]. That's the move that matters: connecting avoided stalls to avoided capital spend or avoided operating spend.
Once you do that, the transport line item starts to read like a finance-grade business case.
Use the same assumption set to test emissions and retention value next.
This is general information, not legal or tax advice.
Once you've modelled cost and parking, use that same commute baseline to estimate carbon and retention. For Scope 3 Category 7 employee commuting, the GHG Protocol gives you three options: the fuel-based method, the distance-based method, and the average-data method [1]. For a shuttle business case, the distance-based method is usually the clearest. It links commute distance to a sourced emission factor in a way that finance and ops teams can both follow.
Start with the same baseline from your cost model. Then apply the GHG Protocol distance-based method. Keep the assumptions plain and visible:
From there, the logic is simple. Multiply shifted car trips by the average one-way commute distance, then apply the emission factor [1].
For the emission factor, use a standard source such as the EPA's GHG Emission Factors Hub [1]. A typical passenger vehicle emits about 400 grams of CO2 per mile [1]. A 20-seat diesel shuttle at 28% occupancy runs about 53% below a single-occupancy vehicle on a per-passenger-mile basis [1].
Call the output what it is: a modelled estimate. Then test both conservative and realistic mode-shift cases. That range is usually easier for people to trust than one neat-looking number.
For retention, keep your feet on the ground. You’re presenting a reasoned business effect, not a promised saving. If you want a firmer estimate, compare shuttle-eligible cohorts with similar non-eligible cohorts at the same site. Then use exit interviews to track when commute issues show up as a contributing factor.
A few data points help shape the range. Each extra 5 minutes of one-way commute time is linked to a 0.8 to 1.0 percentage point increase in voluntary turnover risk [1]. Long-distance commuters are absent about 20% more than employees with no commute burden [5]. Well-run shuttle programmes can cut absenteeism by 20% to 25% [2].
Keep retention and attendance on the same assumption set, so finance sees one model instead of two half-connected stories. That matters when leadership asks, “What changes if uptake is lower than planned?” It also helps to tie the case to hiring reality. A shuttle can extend your practical hiring radius beyond a 20-minute drive, which matters most for hard-to-fill shifts [2]. Night shifts and early starts often have the weakest public transport coverage, so shuttle access can remove a very real barrier for hourly and shift workers [5].
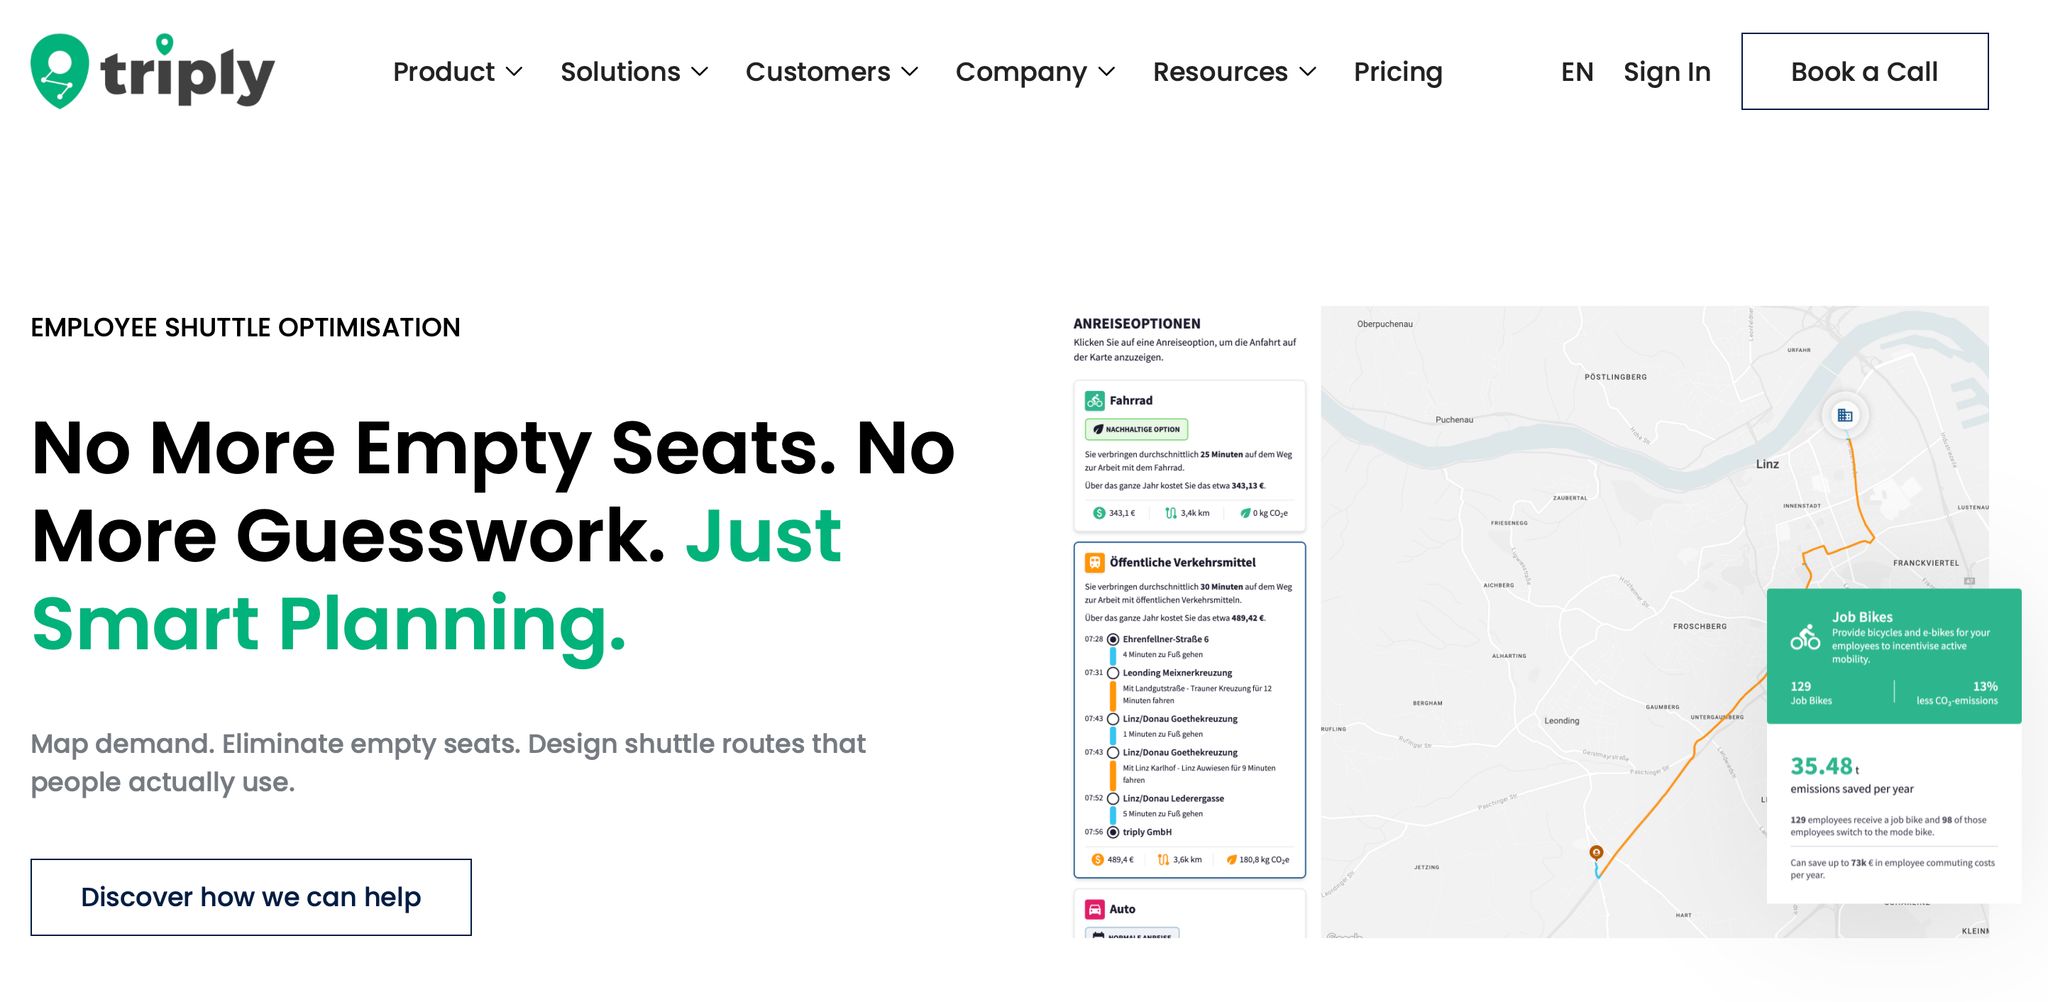
The hard part is that these variables don’t move on their own. Change your mode-shift assumption, and your Scope 3 Category 7 number changes too. Change your load factor, and your cost per boarded rider changes with it.
triply helps you model actual employee commutes from postal codes and shift patterns without surveying every employee. You can test conservative and realistic scenarios and view cost, load factor, and Scope 3 Category 7 impact together before any budget is committed [1]. Use that same commute baseline across all scenarios before taking the case to finance.
This is general information, not legal or tax advice.
Your employee shuttle business case shouldn't hang on one big number. Finance and leadership need a structure they can review, question, and verify.
Start with quantified cost, avoided parking spend, modelled Scope 3 Category 7 reduction, and retention impact. Treat these as costs that already exist, even if they don't yet show up clearly on the commute line.
Once the baseline is clear, use decision thresholds to separate solid proposals from weak ones. Show your quantified baseline, your shuttle proposal, and a sensitivity table that compares conservative and realistic adoption scenarios instead of leaning on a single point estimate. Set your disqualifying thresholds in advance, for example, Year-1 adoption below 20% of eligible employees or Net Promoter Score (NPS) staying below +15 [4].
If there's still doubt after that, test the riskiest assumptions in the field. Propose a 60- to 90-day corridor pilot on one high-density route to check load factor, on-time performance, and rider NPS before committing to a broader rollout. A pilot is reversible; a parking structure is not.
If the pilot confirms the assumptions, turn the model into the approval pack. Use triply to model the commute baseline from postal codes and shift patterns, simulate conservative and realistic scenarios, and present cost, load factor, and Scope 3 Category 7 impact in one model view. Book a demo to see how triply models your employee shuttle business case before budget approval.
An employee shuttle tends to make sense when each route can support 30 to 50 riders per day. That level of demand helps cover the main operating costs, like driver pay, fuel, and dispatch overhead.
A simple rule of thumb: sites with fewer than about 400 employees may have a hard time supporting an efficient route. By contrast, sites with more than 800 employees can often bring down cost per rider by consolidating routes and running at 65% to 75% load factors.
This is general information, not legal or tax advice.
Gather data on where employees live, which transit hubs they use, total headcount, shift patterns, and how people commute today. That gives you a solid view of likely demand by route and time slot.
Then compare what you spend now with what a shuttle programme would cost. Look at parking leases, or the cost to build and maintain parking, mileage reimbursements, parking administration, vehicle hours, fuel, driver labour, and any tech you’d need to run the service.
It also helps to factor in turnover, absenteeism, employee survey feedback, and your current Scope 3 Category 7 emissions.
Use a structured, low-risk pilot built to gather data you can act on. Start with one corridor with the highest concentration of employees instead of rolling this out across the whole site. That gives you a cleaner test of viability and demand with a limited fleet, without biting off more than you can chew.
Track a small set of clear metrics from day one:
Frame the pilot as a data-driven trial that tests the assumptions behind your business case and keeps stakeholder expectations in check. This is general information, not legal or tax advice.



