INFOGRAPHIC

Verlorenes Geld, verpasste Chancen: Mit Mobilitätsdaten echte Einsparungen erzielen

triply GmbH is committed to protecting and respecting your privacy. We use your personal data solely for managing your account and providing the products and services you have requested. From time to time, we would like to inform you about our products and services as well as other content that may be of interest to you. If you agree that we may contact you for this purpose, please indicate below how you would like us to contact you

You can unsubscribe from these notifications at any time. Further information on how to unsubscribe, our privacy practices, and how we protect and respect your privacy can be found in our Privacy Policy.

By clicking ‘Submit’ below, you agree that triply GmbH may store and process the personal data provided above in order to provide you with the requested content.

triply GmbH is committed to protecting and respecting your privacy. We use your personal data solely for managing your account and providing the products and services you have requested. From time to time, we would like to inform you about our products and services as well as other content that may be of interest to you. If you agree that we may contact you for this purpose, please indicate below how you would like us to contact you:

By clicking ‘Submit’ below, you agree that triply GmbH may store and process the personal data provided above in order to provide you with the requested content.

Thank you! Your submission has been received!
Oops! Something went wrong while submitting the form.
rlbooebmwwienerlinientoyotapfizerrhombergtraton_logohypo_logo_grayringana_logoöamtc_logo_gray

Kompakte Infografik + Mini‑Guide: harte Zahlen zu versteckten Kosten, Benchmarks zu Stau & Parken, und ein 5‑Phasen‑Fahrplan von Datenchaos zu Klarheit.

Was Sie lernen

  • Wo die größten „stillen“ Kostentreiber liegen (Kraftstoff, Parkflächen, Leerstand).
  • Wie datengetriebene Mobilitätsanalyse CO₂ pro Meile senkt und Berichte beschleunigt.
  • Welche CSRD‑Hürden Unternehmen nennen — und wie integrierte Datenerhebung hilft.
  • Der 5‑Schritte‑Pfad von Status quo zu messbaren Einsparungen.

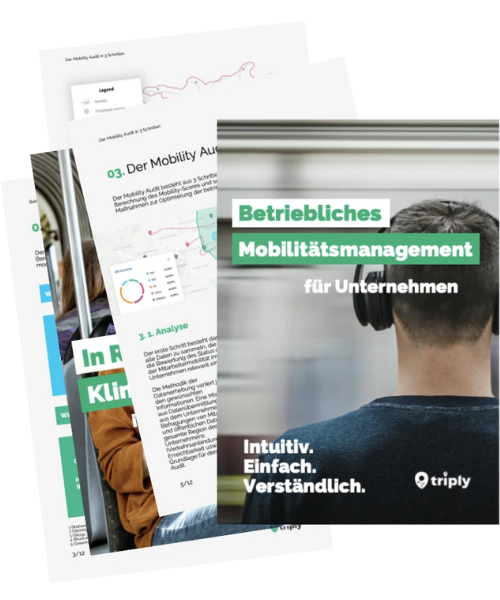
Einblicke in die Infografik

  • Kosten‑Tafeln: Benzinpreis, Parkgebühren (Innenstadt/Sonderflächen), Stau‑Impact.
  • CSRD‑Fakten: Datenerhebung, Scope 3.7, Audit‑Sicherheit.
  • 5‑Phasen‑Roadmap: Daten erfassen → Status quo → Potenziale → Maßnahmen → Reporting.

Warum triply?

Plattform für Pendeldaten, Szenario‑Simulation und CSRD‑Export, eine Quelle für KPIs, Karten und Audit‑Belege.

FAQ
  • Wie detailliert ist es?
    Kompakt; Links zu vertiefenden Ressourcen möglich.
  • Ist es DACH‑spezifisch?
    Ja, Beispiele & Zahlen mit DACH‑Bezug.
  • Kann ich es intern teilen?
    Ja.
  • Entdecke wie wir dir helfen können